How does ROAS differ from contribution after advertising?
ROAS divides attributed revenue by advertising spend without subtracting the other costs of serving those orders. Contribution after advertising subtracts included product, fulfillment, payment, and advertising costs from retained revenue. State every exclusion, reconcile refunds and attribution overlaps, and distinguish observed attributed results from the incremental effect caused by a campaign.
Key numbers
- 5.0
- example attributed ROAS
- $3,600
- contribution before advertising
- $1,600
- contribution after advertising, before overhead
Key takeaways
- Reconcile retained revenue and variable costs on the same basis.
- Calculate a break-even ratio only under explicit margin assumptions.
- Attribution assigns credit; it does not establish causation.
Return on ad spend divides attributed revenue by advertising spend. It does not subtract the cost of the goods, fulfillment, refunds, or payment processing. A campaign can show a positive-looking revenue multiple and still consume more cash than the orders contribute.
This example uses invented order economics to explain a reporting distinction. It does not recommend an advertising budget or claim that attributed revenue is incremental. Those are separate questions, and the difference matters when deciding what to scale.
Section 01
Align the revenue and cost boundaries
Choose a reporting window and state the attribution model and conversion window. Decide whether revenue is before or after discounts, tax, shipping charges, cancellations, and refunds. A platform-reported purchase value may not equal the amount retained by the business. Keep both values if you need to reconcile them.
Record each order once in the economic view, even if several platforms claim it. Joining daily campaign rows to every order in a day multiplies spend. Aggregate at compatible grains and inspect row counts before summing. The spreadsheet merge guide explains why a correct-looking join can still duplicate money.
Section 02
Work through the order economics
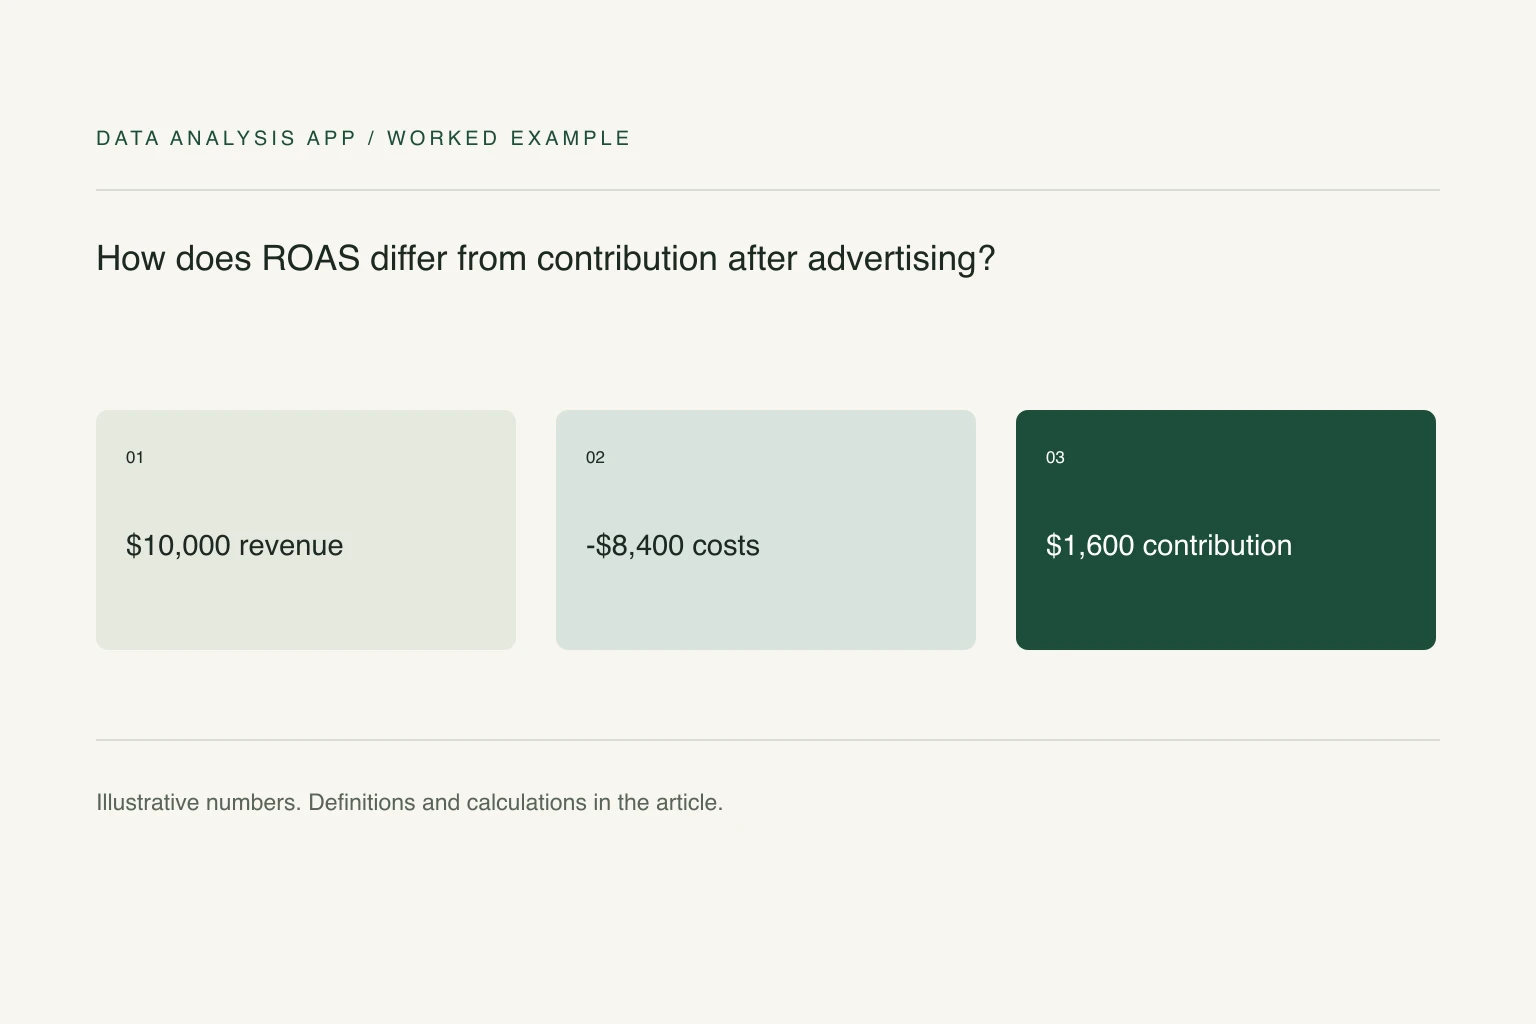
Suppose a campaign claims $10,000 of net revenue and cost $2,000. Reported ROAS is 5.0. Now subtract $5,000 of product costs, $1,000 of fulfillment, and $400 of payment and other variable costs. Contribution before advertising is $3,600. After the $2,000 ad spend, contribution is $1,600, before shared overhead.
If another $2,000 of returns reduces retained revenue and the cost assumptions are otherwise unchanged, contribution after advertising becomes negative $400. In a real return, some inventory or fulfillment costs may be recoverable, so model the actual treatment rather than assuming all costs remain. The point is to reconcile the economics, not to force one pessimistic scenario.
Section 03
Calculate a scenario-specific break-even ratio
In the first scenario, pre-ad contribution margin is $3,600/$10,000 = 36%. With a constant 36% margin, one dollar of revenue contributes $0.36 toward advertising. The corresponding break-even ROAS for contribution after ads is 1/0.36, or about 2.78. This calculation covers only the included variable costs and assumes the margin is stable as sales grow.
It is not a universal target. Changes in product mix, discounts, shipping zones, repeat buying, or return rates change the margin. Fixed overhead and the timing of cash payments also affect the business even though they are outside this particular break-even calculation. Label those exclusions beside the number.
Section 04
Separate attribution from causation
A campaign's attributed orders are orders assigned by a tracking rule. They are not necessarily orders caused by the campaign. Returning customers, brand demand, and overlapping channels can make an attributed result look better than the incremental effect. A revenue bridge or spreadsheet alone does not identify what would have happened without the ads.
Use a suitable experiment or other credible causal design when the decision requires incremental return. Meanwhile, compare observed contribution under consistent definitions and flag missing costs. Do not call an attribution comparison a lift study simply because one campaign's ratio is higher.
Section 05
Build a review that can be checked
Keep the order economics and platform spend totals in separate source tabs. Use SUMIFS or a pivot table to summarize reconciled values by campaign and period. Show orders with missing costs rather than treating their margin as 100%. Review the highest-spend and highest-return exceptions before distributing the dashboard.
The Shopify profitability example shows the value of connecting a conclusion to source evidence. Start a free analysis with an export to inspect its findings and limitations. A useful marketing review tells you what the included orders contributed and which assumptions could reverse the conclusion.
See it on a real project
Three platforms claimed 8,412 conversions but described 4,318 orders. 2,580 of the claims were the same order counted again.
Keep reading
Evidence
Sources
- Microsoft (2026). Sum values based on multiple conditions.
- Data Analysis App team (2026). Related method: sales price volume mix analysis.
- Data Analysis App team (2026). Worked project: ad spend.