How do you separate price, volume, and mix in sales growth?
Aggregate comparable revenue and units by product for both periods. Build a bridge that changes total volume at the old mix and prices, then changes mix at old prices, then changes prices at the new quantities. State the allocation convention, handle new and retired products separately, and reconcile the components to the total revenue change.
Key numbers
- $3,000
- example starting revenue
- $500
- growth from product mix alone
- $0
- price effect in the unchanged-price example
Key takeaways
- Use consistent units and net-revenue definitions.
- State the sequence used to allocate price, volume, and mix.
- Reconcile new and retired products separately from matched products.
Average selling price can rise even when no individual price changes. Selling more of a premium product shifts the average upward. If a report calls that movement a price increase, it can lead the team to repeat a pricing decision that never caused the growth.
This walkthrough uses a fictional two-product shop. It separates a change in total units from a change in the product mix and within-product prices. The allocation convention is stated explicitly so another analyst can reproduce the same bridge.
Section 01
Put the periods on comparable terms
For each product and period, record net revenue and the corresponding units. Use the same treatment of discounts, cancellations, taxes, returns, and currency on both sides. A bundle and a single unit are not comparable until their unit definition is clear. Keep products added or retired during the period in separate groups.
Calculate realized unit price as net revenue divided by units for each product. That is an average realized price, not necessarily its list price. A promotion or changing customer mix can move it. Check for zero or negative unit counts before dividing, and investigate returns rather than hiding their signs.
Section 02
Start with an example where no price changes
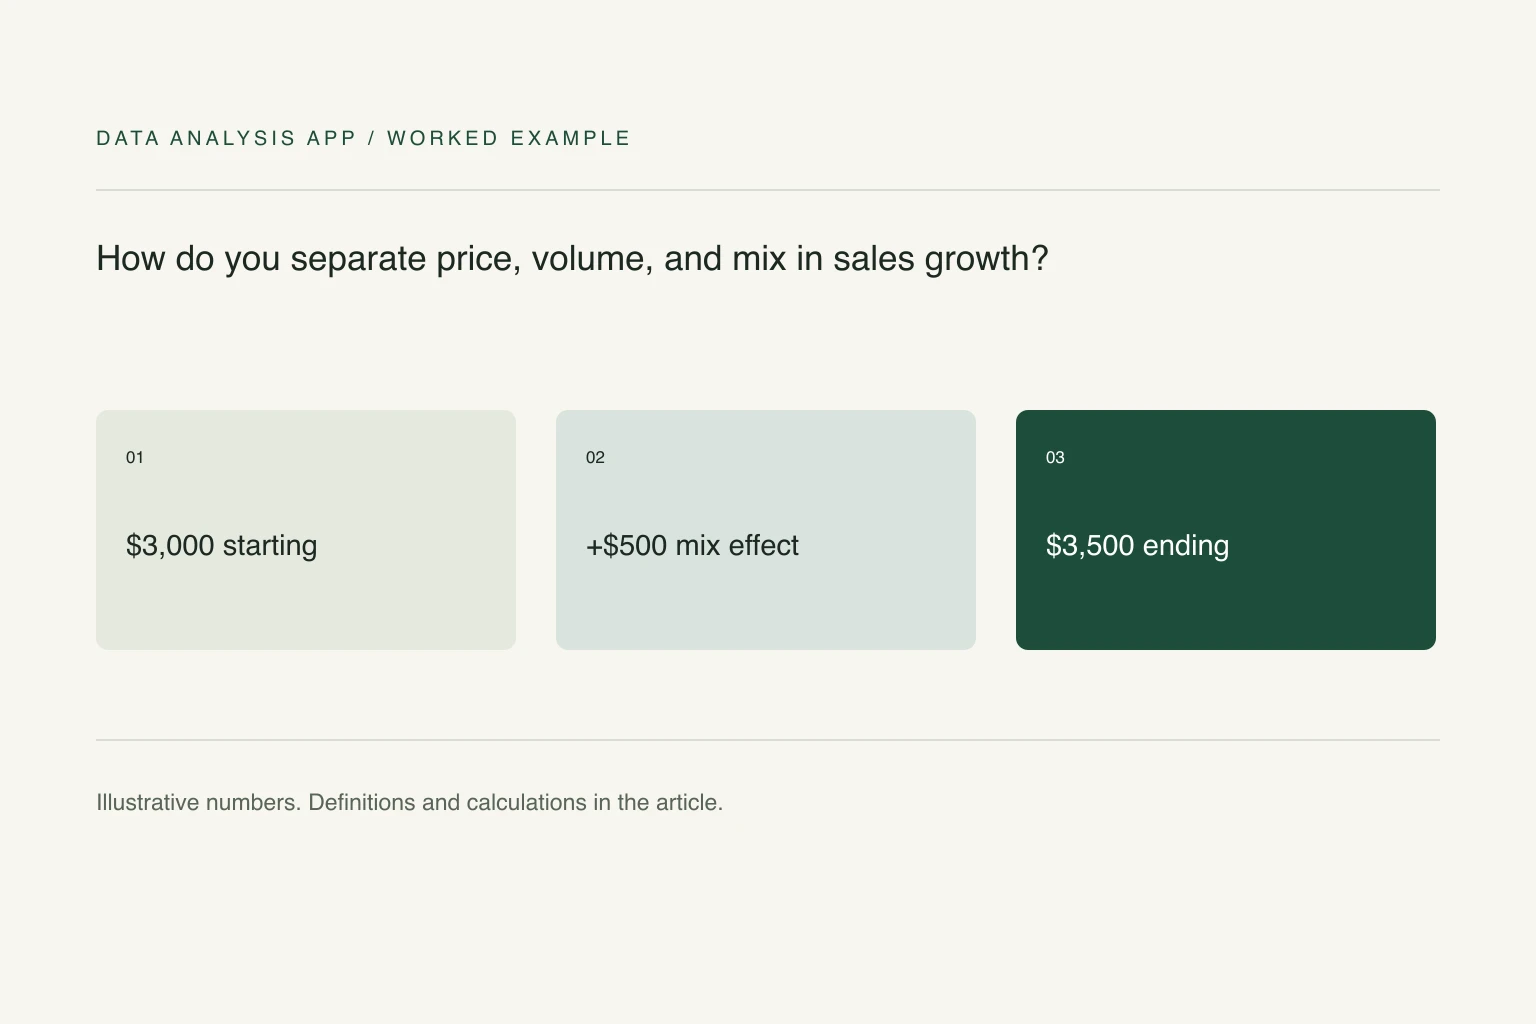
In the first period, Product A sells 100 units at $10 and Product B sells 100 units at $20. Total revenue is $3,000 for 200 units, an average of $15. In the second period, A sells 50 units at $10 and B sells 150 at $20. Revenue is $3,500 for the same 200 units, an average of $17.50.
Revenue grew $500, or about 16.7%, without a price increase or a change in total units. The product mix changed from half B to three-quarters B. A business-wide average price comparison cannot distinguish that from changing prices within products, so keep the SKU-level detail.
Section 03
Build a bridge with an explicit order
For a reproducible convention, first change total units while holding the old mix and prices fixed. Then change the mix at the new total volume while keeping old prices. Finally change prices at the new product quantities. The three movements add to the total revenue difference when the product set and definitions align.
In the simple example, the volume effect is zero because total units stay at 200. The mix effect is $500, and the price effect is zero. If B's second-period realized price instead becomes $22, its 150 units add a further $300. Ending revenue becomes $3,800, with a $500 mix effect plus a $300 price effect.
Section 04
Keep new products and missing data visible
A newly introduced product has no prior price or prior mix share. Report its revenue separately rather than inventing a baseline price to force it into the existing-product bridge. Do the same for discontinued products and unmatched SKU codes. Reconcile those groups with the matched-product bridge to the complete revenue change.
Excel SUMIFS can aggregate net revenue and units by SKU and period before the decomposition. Never average row-level unit prices without considering their unit weights. The average versus median guide explains why a summary statistic can answer a different question from the one a reader assumes.
Section 05
Use the bridge to choose the next question
A favorable revenue mix does not prove a favorable profit mix. The premium product may have higher fulfillment costs, returns, or acquisition costs. Run the same review on contribution where cost data are available, with the cost definition beside the result. A product's share of sales is not its share of profit.
Compare the result with the Shopify profitability example, or start a free analysis with a product export. Check the source rows and conventions before presenting a pricing conclusion. The bridge reconciles what changed; explaining why customers changed their choices requires additional evidence.
See it on a real project
Product A produced 68% of total growth while repeat purchasing fell from 31% to 24%.
Keep reading
Evidence
Sources
- Microsoft (2026). Sum values based on multiple conditions.
- Data Analysis App team (2026). Related method: average or median.
- Data Analysis App team (2026). Worked project: shopify profitability.