Analyze survey responses.
- Formats accepted
- 20
- Stages
- 3
- Analysis behind it
- the full one
No account needed to start. You only pay when you like what you see.
- .xlsx. Excel workbook. Every sheet read, including the ones that are notes rather than data.
- .xls. Excel 97–2003. Read the same as a modern workbook.
- .xlsm. Excel, macro-enabled. Values and formulas are read. Macros are never executed.
- .ods. OpenDocument spreadsheet. LibreOffice and OpenOffice workbooks, read like Excel.
- .numbers. Apple Numbers. Tables are pulled out of the Numbers package sheet by sheet.
- .csv. CSV. Delimiter, quoting and encoding detected rather than assumed.
- .tsv. Tab-separated. Read as delimited text.
- .pdf. PDF. Checked for a text layer first. A PDF written by software keeps its table structure; a scan is read as an image and told apart from the first kind.
- .docx. Word document. Tables are lifted out of the document; the prose around them is kept as context.
- .pptx. PowerPoint deck. Tables and the data behind native charts are read slide by slide.
- .rtf. Rich text. Tables extracted, formatting discarded.
- .sav. SPSS data. Variable labels, value labels and missing-value codes are all read, so a 5 stays “Strongly agree” and a 99 stays missing.
- .zsav. SPSS data, compressed. Read the same as .sav.
- .por. SPSS portable. Read the same as .sav.
- .dta. Stata data. Variable and value labels are kept, so the codebook does not have to be re-typed.
- .sas7bdat. SAS data. Read with its formats, including dates.
- .xpt. SAS transport. The interchange format SAS itself exports. Read like a .sas7bdat.
- .txt. Plain text. Read as notes, or as data when the contents turn out to be a table.
- .md. Markdown. Markdown tables become tables; the rest becomes context for the analysis.
- .zip. Zip archive. Unpacked, and each file inside is treated as though you had uploaded it yourself.
What comes back
A finished project, rendered by the components that render your own.
The difference you were testing for is not there. Two you were not testing for are.
The gap in satisfaction between new and long-standing customers disappears once completion bias is accounted for: unhappy new customers were far more likely to abandon the survey, which flattered the group they left behind. Two effects that were not the subject of the survey do hold: response speed predicts satisfaction, and the two reverse-coded questions were being answered inconsistently enough to distort the overall score.
Unhappy new customers stopped answering
- 01The new-versus-established gap is an artefact of who stopped answering.
- 02Two questions were being read the wrong way round by respondents.
- 03Response delay predicts satisfaction better than any segment does.
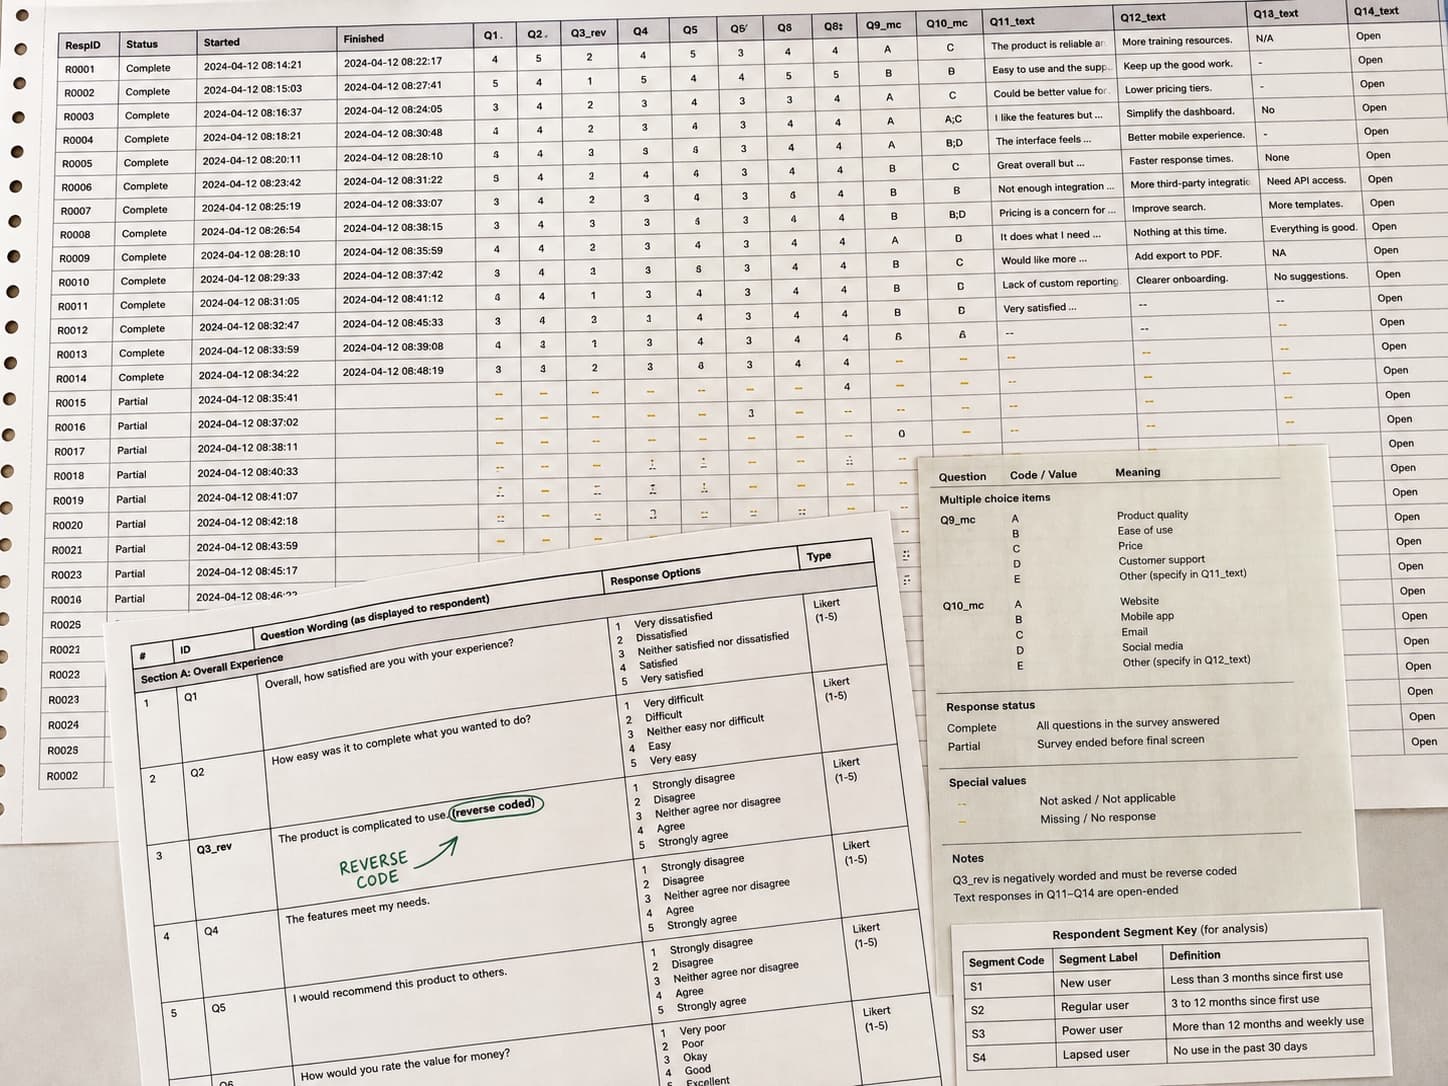
It reads the questionnaire, not just the columns
Scale points, negatively worded items and select-all questions each behave differently, and treating them alike is what produces a confident average of two incompatible things. If a codebook is included it is matched against the headers; if not, the polarity is inferred and shown to you before anything is averaged.
It checks who answered before it compares groups
Most survey findings that fall apart do so because the people who dropped out differ from the people who finished. Completion and non-response are tested first, so a difference between segments is not reported until it survives that.
It refuses to report a percentage of eleven people
Segments below thirty responses are reported as counts, because at that size one respondent moves the rate by more than the effect being measured. Small cells are named rather than quietly averaged into a chart.
It expects a mess.
Most files that arrive here have several tables on one sheet, a title block above the data, totals stranded in the middle of it, and dates in more than one format. That is the normal case, not the awkward one.
- Findings ranked by whether they survive scrutiny
- Distribution and cross-tab charts
- Free-text themes set against the scores
- Recoded, cleaned .xlsx
- Methodology, including every treatment decision
| Order | Date | Customer | Amt |
|---|---|---|---|
| 10241 | 07/02/26 | John Smith | $84.00 |
| 10242 | 2 July 2026 | SARAH LOPEZ | $41.00 |
| 10242 | 2 July 2026 | SARAH LOPEZ | $41.00 |
| 10243 | 45840 | s. lopez | 41 |
| Not supplied | Not supplied | SUBTOTAL | $166.00 |
| 10244 | 2026-07-03 | Amara Osei | $127.50 |
Questions it works through
Run against every dimension, not the three you had time for.
- Is the difference between these groups real, or is it who answered?
- Which of my questions are actually measuring the same thing?
- What do the people who abandoned the survey have in common?
- Does the free text agree with the scores?
Questions people ask
Before anybody has uploaded anything.
Can it handle partial responses?
Yes, and how it handles them is disclosed rather than assumed. Partial responses are kept at the last answered question by default, because discarding them silently removes the people most likely to be unhappy. The worked example is a case where that decision reverses the headline result.
What about negatively worded questions?
They are recoded before anything is averaged, and then checked: if an item still correlates oddly with the rest of the scale after recoding, that is reported as a finding rather than buried in the mean.
Does it read free-text answers?
Yes, and it sets them against the scores rather than summarising them separately. A theme that appears in 40 comments matters differently depending on whether those 40 people rated you 2 or 5.
Will it tell me something is not significant?
Yes. A finding here is allowed to lose, and the sample project's headline is a difference that turned out not to be there. A tool that only ever confirms what you hoped is not analysing anything.
Keep going
The neighbouring jobs, and what happens to each file type this takes.
Upload survey results
No account needed to start. You only pay when you like what you see.