Analyze an Excel file.
- Formats accepted
- 16
- Stages
- 3
- Analysis behind it
- the full one
No account needed to start. You only pay when you like what you see.
- .xlsx. Excel workbook. Every sheet read, including the ones that are notes rather than data.
- .xls. Excel 97–2003. Read the same as a modern workbook.
- .xlsm. Excel, macro-enabled. Values and formulas are read. Macros are never executed.
- .ods. OpenDocument spreadsheet. LibreOffice and OpenOffice workbooks, read like Excel.
- .numbers. Apple Numbers. Tables are pulled out of the Numbers package sheet by sheet.
- .csv. CSV. Delimiter, quoting and encoding detected rather than assumed.
- .tsv. Tab-separated. Read as delimited text.
- .json. JSON. Nested objects are flattened into tables, keeping the path as the column name.
- .ndjson. Newline-delimited JSON. Streamed a record at a time, so an export of any size is fine.
- .xml. XML. Repeated elements become rows; attributes become columns.
- .parquet. Parquet. Read columnwise, with the file's own types kept.
- .sqlite. SQLite database. Every table read, with the foreign keys used to work out how they relate.
- .db. SQLite database. Read as SQLite when the file is one, and reported plainly when it is not.
- .txt. Plain text. Read as notes, or as data when the contents turn out to be a table.
- .md. Markdown. Markdown tables become tables; the rest becomes context for the analysis.
- .zip. Zip archive. Unpacked, and each file inside is treated as though you had uploaded it yourself.
What comes back
A finished project, rendered by the components that render your own.
Revenue is growing, but your growth is becoming less durable.
Revenue increased 23% over the period. Almost all of that growth came from a single product, while the share of customers who buy more than once fell from 31% to 24%. The business is getting bigger and less repeatable at the same time.
Revenue over time
- 01Product A produced 68% of total growth.
- 02Repeat purchase rate fell from 31% to 24%.
- 03Product F's refund rate is 2.8× the portfolio average.
It works out what the file is
Sales history, a survey export, a budget, a transaction log. What Data Analysis App investigates depends on what the data actually represents, so it establishes that first and tells you what it concluded.
It investigates rather than summarising
Finding that revenue fell is not analysis. Data Analysis App forms hypotheses about why, tests each against the data, and eliminates the ones that do not hold.
It challenges its own conclusions
Every high-impact finding is re-tested. Remove the largest customer, use a different metric definition or drop a month, and anything that does not survive is downgraded or withdrawn.
It expects a mess.
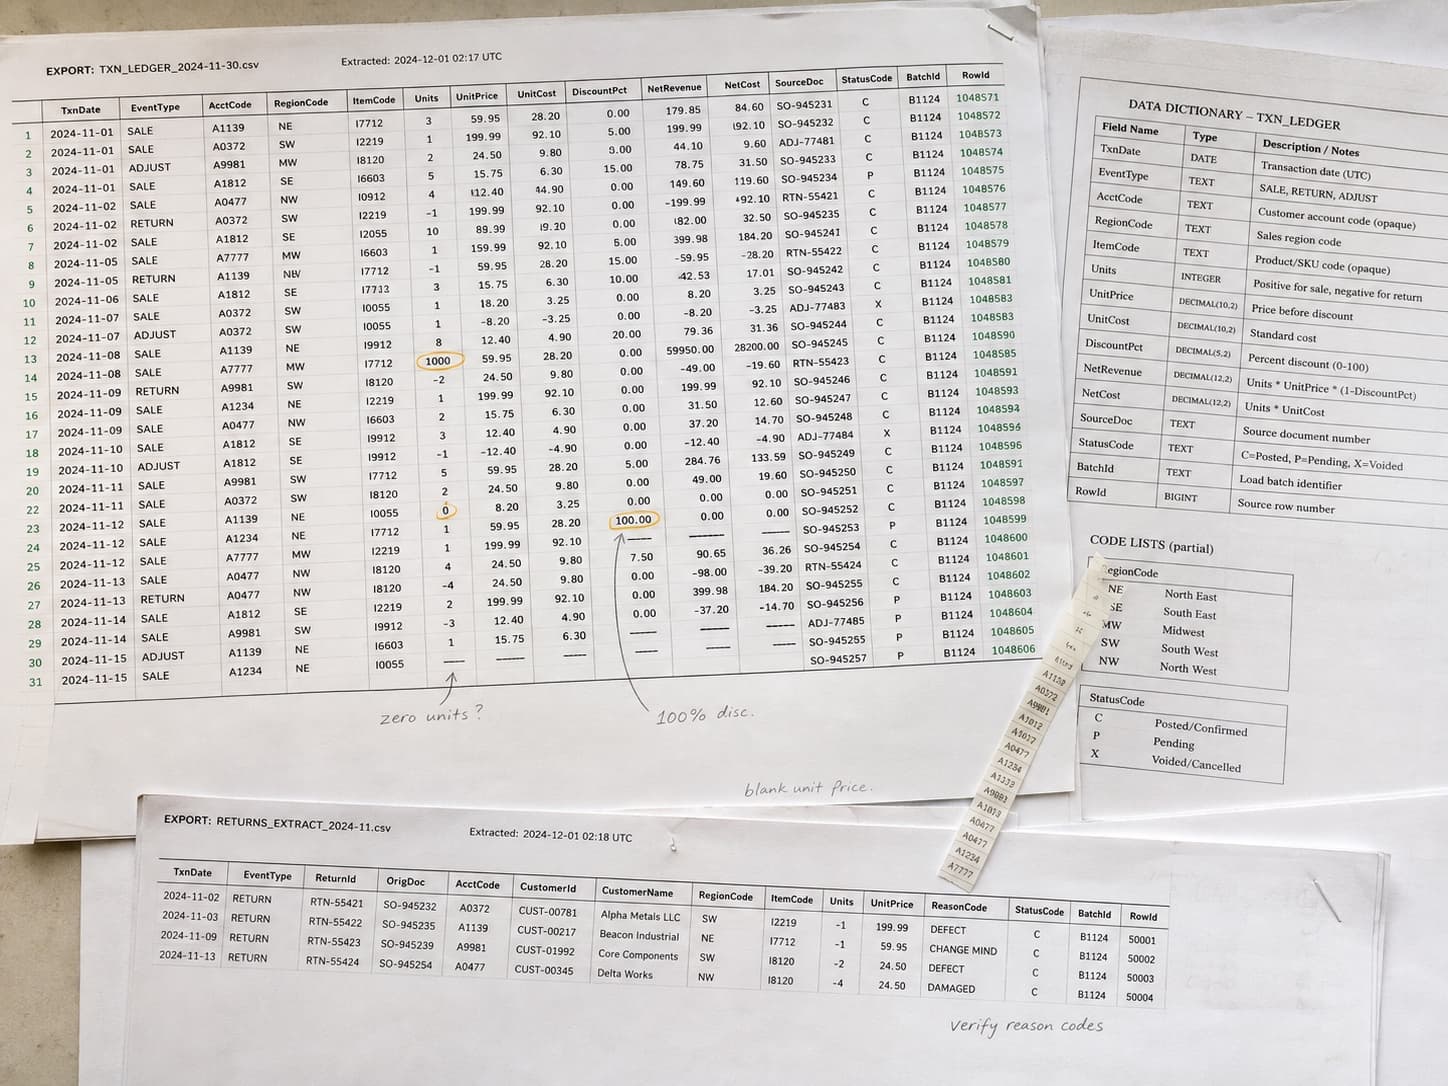
Most files that arrive here have several tables on one sheet, a title block above the data, totals stranded in the middle of it, and dates in more than one format. That is the normal case, not the awkward one.
- Ranked findings with evidence
- Supporting charts
- Cleaned .xlsx
- Methodology
| Order | Date | Customer | Amt |
|---|---|---|---|
| 10241 | 07/02/26 | John Smith | $84.00 |
| 10242 | 2 July 2026 | SARAH LOPEZ | $41.00 |
| 10242 | 2 July 2026 | SARAH LOPEZ | $41.00 |
| 10243 | 45840 | s. lopez | 41 |
| Not supplied | Not supplied | SUBTOTAL | $166.00 |
| 10244 | 2026-07-03 | Amara Osei | $127.50 |
Questions it works through
Run against every dimension, not the three you had time for.
- What changed, and which part of the business caused it?
- Is this trend real, or is one large record carrying it?
- Which of these numbers would survive a different definition?
- What is the thing in here I would not have thought to look for?
Questions people ask
Before anybody has uploaded anything.
How is this different from asking a chatbot about my spreadsheet?
A chatbot reads what fits in its context and tells you what it looks like. Data Analysis App runs the calculations in code, re-runs them independently to check, and shows you the rows behind every number. If a figure cannot be traced, it is not shown.
What if it gets something wrong?
Open any finding and challenge it. The check runs again and can genuinely come back weaker or withdrawn: findings here are allowed to lose. If a conclusion still does not hold up, tell us through the contact page and a person will look at the project with you.
How big a file can I upload?
Up to 250 MB per file, and 2 files on a free project. Large files are processed as columnar data rather than loaded into a chat window, so size affects time rather than accuracy.
Is my data used to train anything?
No. No model is trained on your data and nothing is retained by a model provider. Files are processed to build your project and then deleted on the schedule you choose: straight after the run, after thirty days, or whenever you ask.
Keep going
The neighbouring jobs, and what happens to each file type this takes.
Upload Excel
No account needed to start. You only pay when you like what you see.