Turn Excel into a dashboard.
- Formats accepted
- 15
- Stages
- 3
- Analysis behind it
- the full one
No account needed to start. You only pay when you like what you see.
- .xlsx. Excel workbook. Every sheet read, including the ones that are notes rather than data.
- .xls. Excel 97–2003. Read the same as a modern workbook.
- .xlsm. Excel, macro-enabled. Values and formulas are read. Macros are never executed.
- .ods. OpenDocument spreadsheet. LibreOffice and OpenOffice workbooks, read like Excel.
- .numbers. Apple Numbers. Tables are pulled out of the Numbers package sheet by sheet.
- .csv. CSV. Delimiter, quoting and encoding detected rather than assumed.
- .tsv. Tab-separated. Read as delimited text.
- .pbix. Power BI report. The tables inside the report are read out of its model, along with the measures that were defined on top of them, so your own definitions are used rather than re-invented.
- .pbit. Power BI template. A template carries the model and the measures without the data, and is read for both.
- .twbx. Tableau packaged workbook. The packaged extract is read as data, and the workbook beside it supplies the calculated fields.
- .twb. Tableau workbook. Calculated fields and the shape of each sheet are read.
- .hyper. Tableau extract. Read straight through, table by table.
- .txt. Plain text. Read as notes, or as data when the contents turn out to be a table.
- .md. Markdown. Markdown tables become tables; the rest becomes context for the analysis.
- .zip. Zip archive. Unpacked, and each file inside is treated as though you had uploaded it yourself.
What comes back
A finished project, rendered by the components that render your own.
Revenue is growing, but your growth is becoming less durable.
Revenue increased 23% over the period. Almost all of that growth came from a single product, while the share of customers who buy more than once fell from 31% to 24%. The business is getting bigger and less repeatable at the same time.
Revenue over time
- 01Product A produced 68% of total growth.
- 02Repeat purchase rate fell from 31% to 24%.
- 03Product F's refund rate is 2.8× the portfolio average.
It reads the workbook, not just the cells
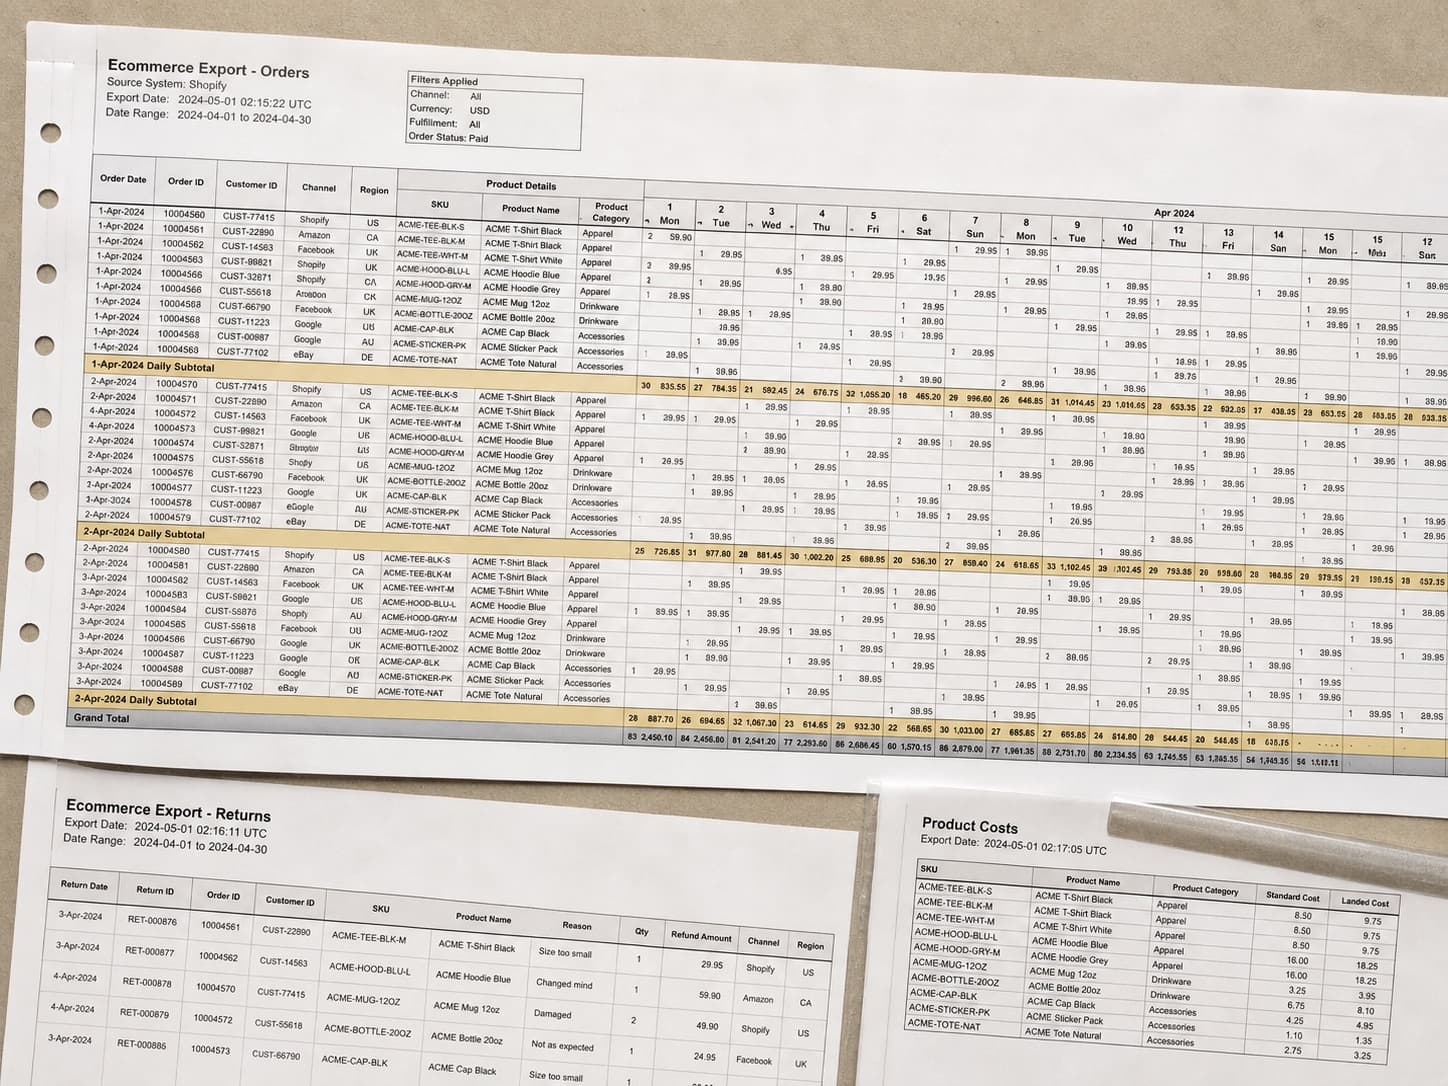
Multiple sheets, merged headers, a title block above the data, totals stranded in the middle of it. Data Analysis App finds where the real tables start and end before it calculates anything.
It decides what is worth a chart
Not every column deserves one. Data Analysis App works out which measures matter for this data, then chooses the chart form that answers the question: a trend, a contribution or a distribution.
It checks the numbers before showing them
Every figure on the dashboard is recomputed independently before it reaches you, and every one of them opens to its calculation and source rows.
It expects a mess.
Most files that arrive here have several tables on one sheet, a title block above the data, totals stranded in the middle of it, and dates in more than one format. That is the normal case, not the awkward one.
- Interactive dashboard
- Every chart as an image
- Cleaned .xlsx
- PDF report
| Order | Date | Customer | Amt |
|---|---|---|---|
| 10241 | 07/02/26 | John Smith | $84.00 |
| 10242 | 2 July 2026 | SARAH LOPEZ | $41.00 |
| 10242 | 2 July 2026 | SARAH LOPEZ | $41.00 |
| 10243 | 45840 | s. lopez | 41 |
| Not supplied | Not supplied | SUBTOTAL | $166.00 |
| 10244 | 2026-07-03 | Amara Osei | $127.50 |
Questions it works through
Run against every dimension, not the three you had time for.
- Which products or categories are actually driving the total?
- What changed between this period and the last one, and why?
- Where is the number moving because of volume, and where because of price?
- Which segments are getting worse while the headline gets better?
Questions people ask
Before anybody has uploaded anything.
Does my spreadsheet need to be tidy first?
No. Merged cells, several tables on one sheet, dates in four formats and duplicate rows are all expected. Cleaning it is most of what Data Analysis App does, and it shows you every repair it made.
What if the workbook has several sheets?
It reads all of them, works out which contain data rather than notes or totals, and figures out how they relate: for example matching orders to a product cost sheet on SKU.
Can I change the dashboard afterwards?
Yes. Tell it what to change in plain language, remove wholesale customers, focus on profit, compare against February, and the dashboard updates, with an undo for the changes that can be stepped back.
Do I have to pay to see whether it worked?
No. The analysis runs first, and you see the headline finding, the chart behind it and the receipt showing which rows produced the number before there is anything to pay for. Payment is for the output formats: the workbook, the deck, and re-running the same analysis on next month's file.
Keep going
The neighbouring jobs, and what happens to each file type this takes.
Upload Excel
No account needed to start. You only pay when you like what you see.