Turn a booking log into a dashboard.
- Formats accepted
- 14
- Stages
- 3
- Analysis behind it
- the full one
No account needed to start. You only pay when you like what you see.
- .xlsx. Excel workbook. Every sheet read, including the ones that are notes rather than data.
- .xls. Excel 97–2003. Read the same as a modern workbook.
- .xlsm. Excel, macro-enabled. Values and formulas are read. Macros are never executed.
- .ods. OpenDocument spreadsheet. LibreOffice and OpenOffice workbooks, read like Excel.
- .numbers. Apple Numbers. Tables are pulled out of the Numbers package sheet by sheet.
- .csv. CSV. Delimiter, quoting and encoding detected rather than assumed.
- .tsv. Tab-separated. Read as delimited text.
- .pdf. PDF. Checked for a text layer first. A PDF written by software keeps its table structure; a scan is read as an image and told apart from the first kind.
- .docx. Word document. Tables are lifted out of the document; the prose around them is kept as context.
- .pptx. PowerPoint deck. Tables and the data behind native charts are read slide by slide.
- .rtf. Rich text. Tables extracted, formatting discarded.
- .txt. Plain text. Read as notes, or as data when the contents turn out to be a table.
- .md. Markdown. Markdown tables become tables; the rest becomes context for the analysis.
- .zip. Zip archive. Unpacked, and each file inside is treated as though you had uploaded it yourself.
What comes back
A finished project, rendered by the components that render your own.
The no-show rate is not 22%, and what remains is caused by your own booking horizon.
The 22.4% figure the practice reports adds three unlike events together: appointments nobody attended, late cancellations whose slot was re-filled, and changes the clinic made itself. Separated, the unrecovered rate is 11.4%. Almost all of it sits in appointments booked more than a month ahead, which miss at 3.9 times the rate of appointments booked within a week, and the overbooking used to absorb missed appointments is what pushes routine bookings out that far.
How far ahead it was booked predicts whether anyone comes
3.9× the rate of an appointment booked this week
- 01The 22.4% rate adds three different events together.
- 02Appointments booked over a month ahead miss at 3.9 times the rate.
- 03Overbooking to cover no-shows is manufacturing the next ones.
It gets the denominator right
Most booking dashboards divide by slots that were booked, which cannot go below 100% and therefore says nothing. Offered slots are read from the rota, with blocked administrative time excluded and walk-ins kept out of the denominator because they occupy a slot that was never offered. This changes the worked example by 3.1 points.
It shows the week the way it is worked
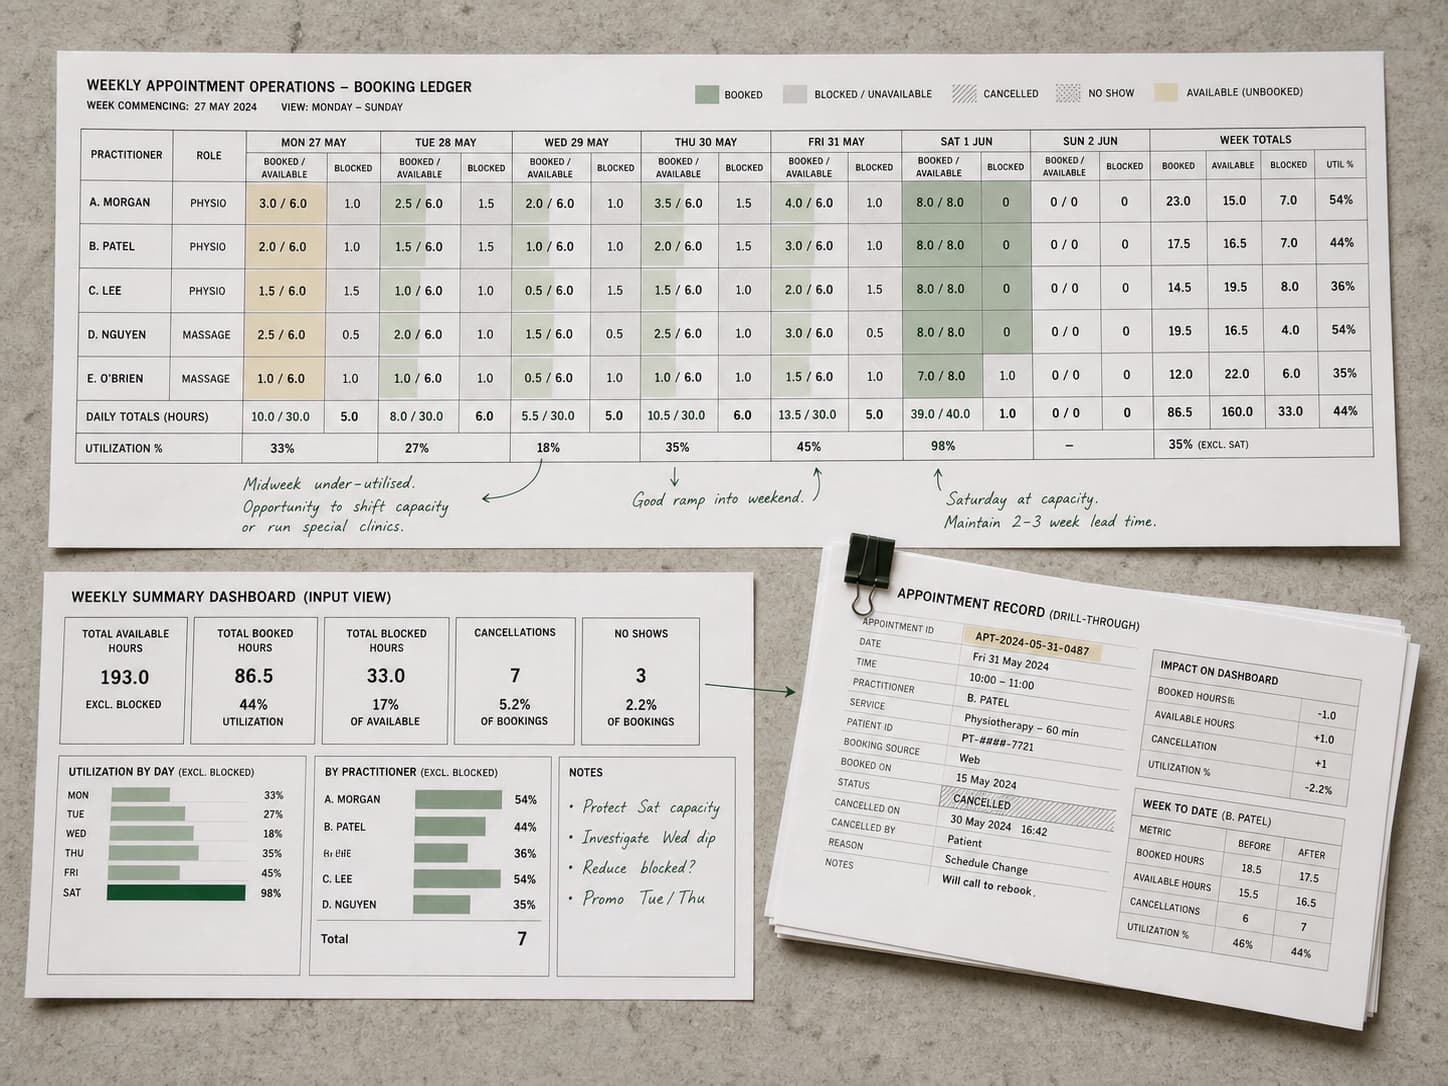
A monthly average hides the shape of the problem. By session, the example's practice has two afternoons running at 61% and 63% next to a Saturday clinic at 96%. That is 1,064 empty midweek slots being answered with premium weekend staffing.
Every tile opens
Each figure on the dashboard is recomputed independently before it is shown, and opens to its calculation, its filters and the slots behind it. A utilisation number you cannot take apart is a number you cannot take to a partners' meeting.
It expects a mess.
Most files that arrive here have several tables on one sheet, a title block above the data, totals stranded in the middle of it, and dates in more than one format. That is the normal case, not the awkward one.
- Interactive dashboard: utilisation, attendance, demand
- By session, day, clinician and appointment type
- Capacity against demand, with the gaps named
- Every chart as an image, plus a PDF
- Cleaned .xlsx
| Patient | Booked | Appt date | Status |
|---|---|---|---|
| P-04812 | 08/01/26 | 12/01/26 | Attended |
| P-04813 | 12 Jan 2026 | 14/01/2026 | Attended |
| P-04813 | 12 Jan 2026 | 14/01/2026 | Attended |
| P-04814 | 46074 | 2026-02-25 | no show |
| Not supplied | Not supplied | TOTAL NO-SHOWS | 312 |
| P-04815 | 2026-01-19 | 2026-01-23 | Attended |
Questions it works through
Run against every dimension, not the three you had time for.
- Which sessions am I paying for and not filling?
- Do I need more hours, or the same hours in different places?
- Where is demand actually concentrated?
- Is one person's list behaving differently from everyone else's?
Questions people ask
Before anybody has uploaded anything.
What if my export does not say how many slots were offered?
Add the rota or the session template and utilisation becomes measurable. Without it you get booked volumes, attendance and demand patterns, and utilisation is reported as unavailable rather than divided by a number that happens to be there.
How is this different from the reports in my booking system?
Your booking system reports its own definitions and does not show its working. Here every definition is written down, what counts as a slot, what happens to walk-ins, which cancellations are excluded, and every figure opens to the rows it came from.
Can I change what it shows?
Yes, in plain language. Split by room instead of clinician, drop the Saturday clinic, compare this quarter with last: the dashboard rebuilds, with an undo for the changes that can be stepped back.
Does it work for rooms, chairs or equipment?
Anything booked into a slot works the same way. The unit can be a person, a room, a bay or a machine; the analysis only needs to know what was offered and what was taken.
Keep going
The neighbouring jobs, and what happens to each file type this takes.
Upload booking export
No account needed to start. You only pay when you like what you see.