Why do two people get different totals from the same spreadsheet?
Almost never arithmetic. Four structural causes account for nearly all of it, and each leaves a signature: a total roughly double means subtotal rows were counted as data; slightly too high means duplicate rows from an export that ran twice; a disagreement between two people means an uncleared filter; slightly too low means numbers stored as text, which most tools silently skip when summing.
Section 01
Are your subtotal rows being counted as data?
Very probably, and it is the most common cause by a distance. Someone adds a subtotal line under each region, and later someone else sums the whole column, so every value is counted twice, once as itself and once inside its subtotal.
The signature is a total that is almost exactly double, or a total that exceeds the sum of the parts by a suspiciously round proportion. If your figure is 2× another, look for subtotals before you look at anything else.
It is hard to see because subtotal rows look like data rows. They sit in the same columns, they are formatted the same way, and they are usually not labelled as totals in any machine-readable sense.
Rule of thumb: if a row's value equals the sum of the rows immediately above it, it is a subtotal, not an observation.
Section 02
Did an export run twice and duplicate the rows?
Exports get re-run. A report is generated on Monday, someone re-runs it on Tuesday to catch late data, and both results end up in the same sheet.
Duplicates from this cause are rarely identical, a timestamp or a status field usually differs, which is why de-duplicating on the whole row misses them. Match on the identifier that means something: an order id, an invoice number, a respondent id.
Where there is no identifier, match on the combination of fields that should be unique together, and treat anything that collides as a question rather than an answer.
Section 03
Is a filter still applied that someone forgot to clear?
A filtered view sums only what is visible in some tools and everything in others. Two people looking at the same file with different filters applied will disagree, and neither will realise the other is looking at a different set of rows.
This is the one that survives being checked twice, because both people check their own screen and both are right about what they can see.
Section 04
Are some of your numbers stored as text?
A value that arrives as "1,240.00" with a leading space or a trailing non-breaking space is text. Most tools quietly skip it when summing, so the total is not wrong so much as incomplete.
The signature is a total that is slightly too small, with no obvious missing rows. Left-aligned values in a numeric column are the visual tell.
This is worth checking early because it is silent. Nothing warns you, and the shortfall is usually small enough to look plausible.
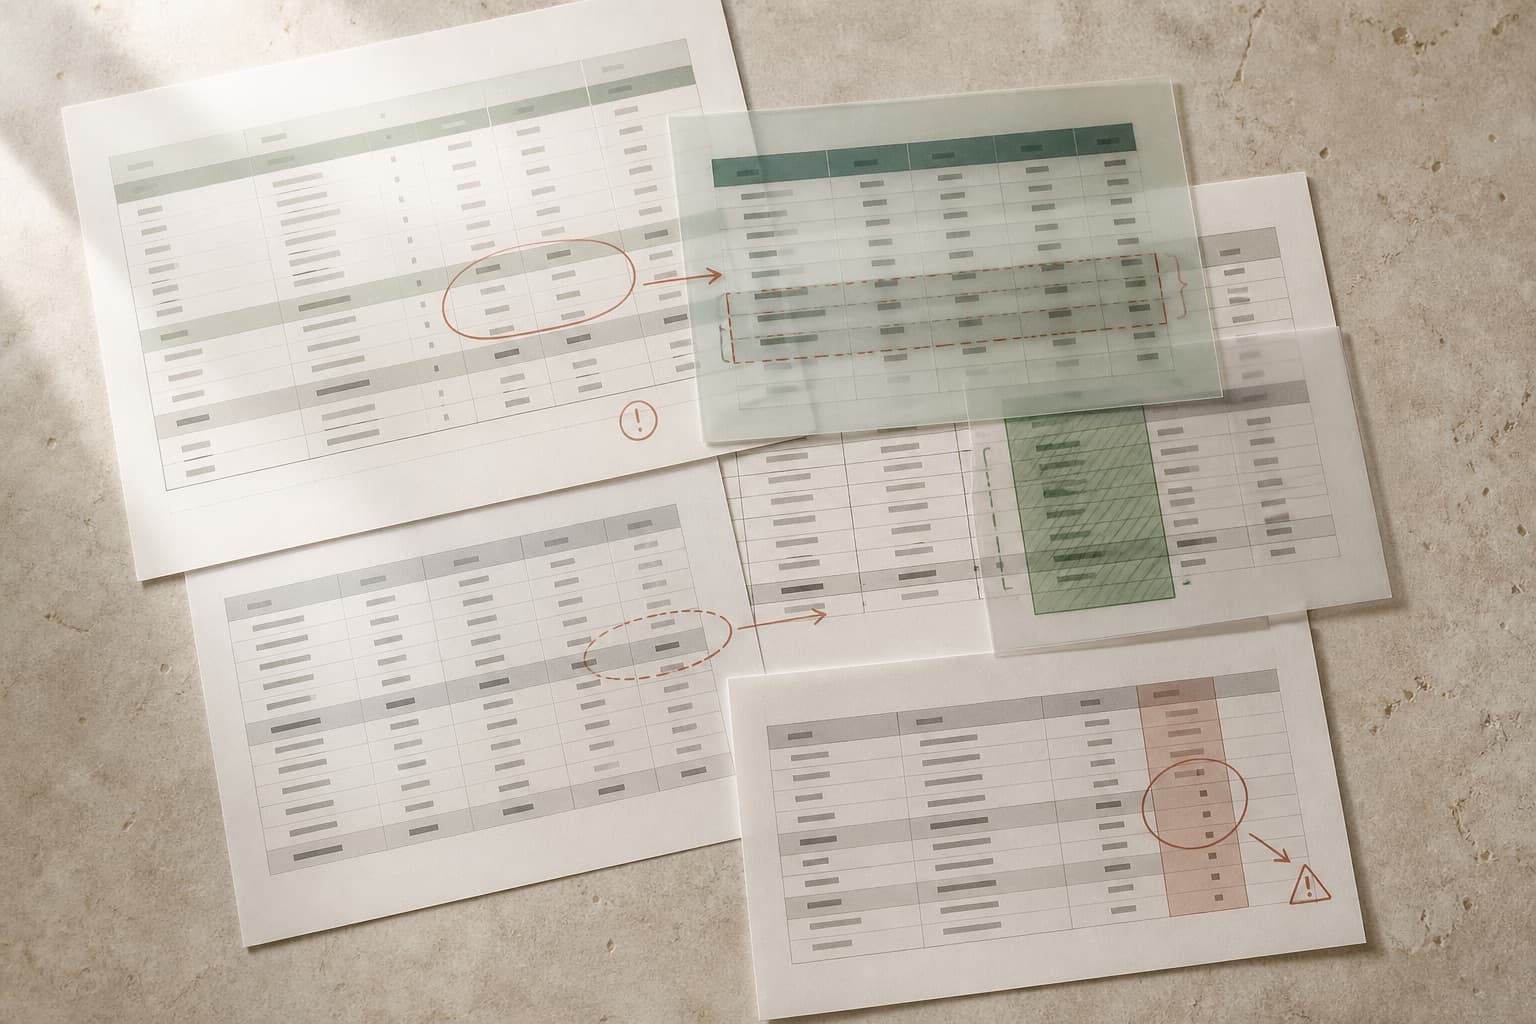
The four causes have different signatures: too big by 2× means subtotals, too big by a bit means duplicates, inconsistent between people means filters, slightly too small means text.
See it on a real project
Product A produced 68% of total growth while repeat purchasing fell from 31% to 24%.
Keep reading