How do you calculate a weighted average percentage in Excel?
Multiply each percentage by its matching denominator, sum those products, and divide by the sum of the denominators. When original counts are available, divide total successes by total attempts instead. Use compatible, nonoverlapping populations, exclude missing pairs explicitly, and report an unavailable result when the total denominator is zero.
Key numbers
- 90%
- 9 successes in 10 attempts
- 10%
- 9 successes in 90 attempts
- 18%
- 18 successes in 100 attempts
Key takeaways
- Use the denominator that matches the question.
- Calculate from original counts before rounding.
- A zero base is unavailable, not a zero-percent result.
An average of percentages gives each row equal influence. That may be appropriate when each row represents an equally important unit, but it is usually wrong for the conversion rate across campaigns with very different traffic volumes.
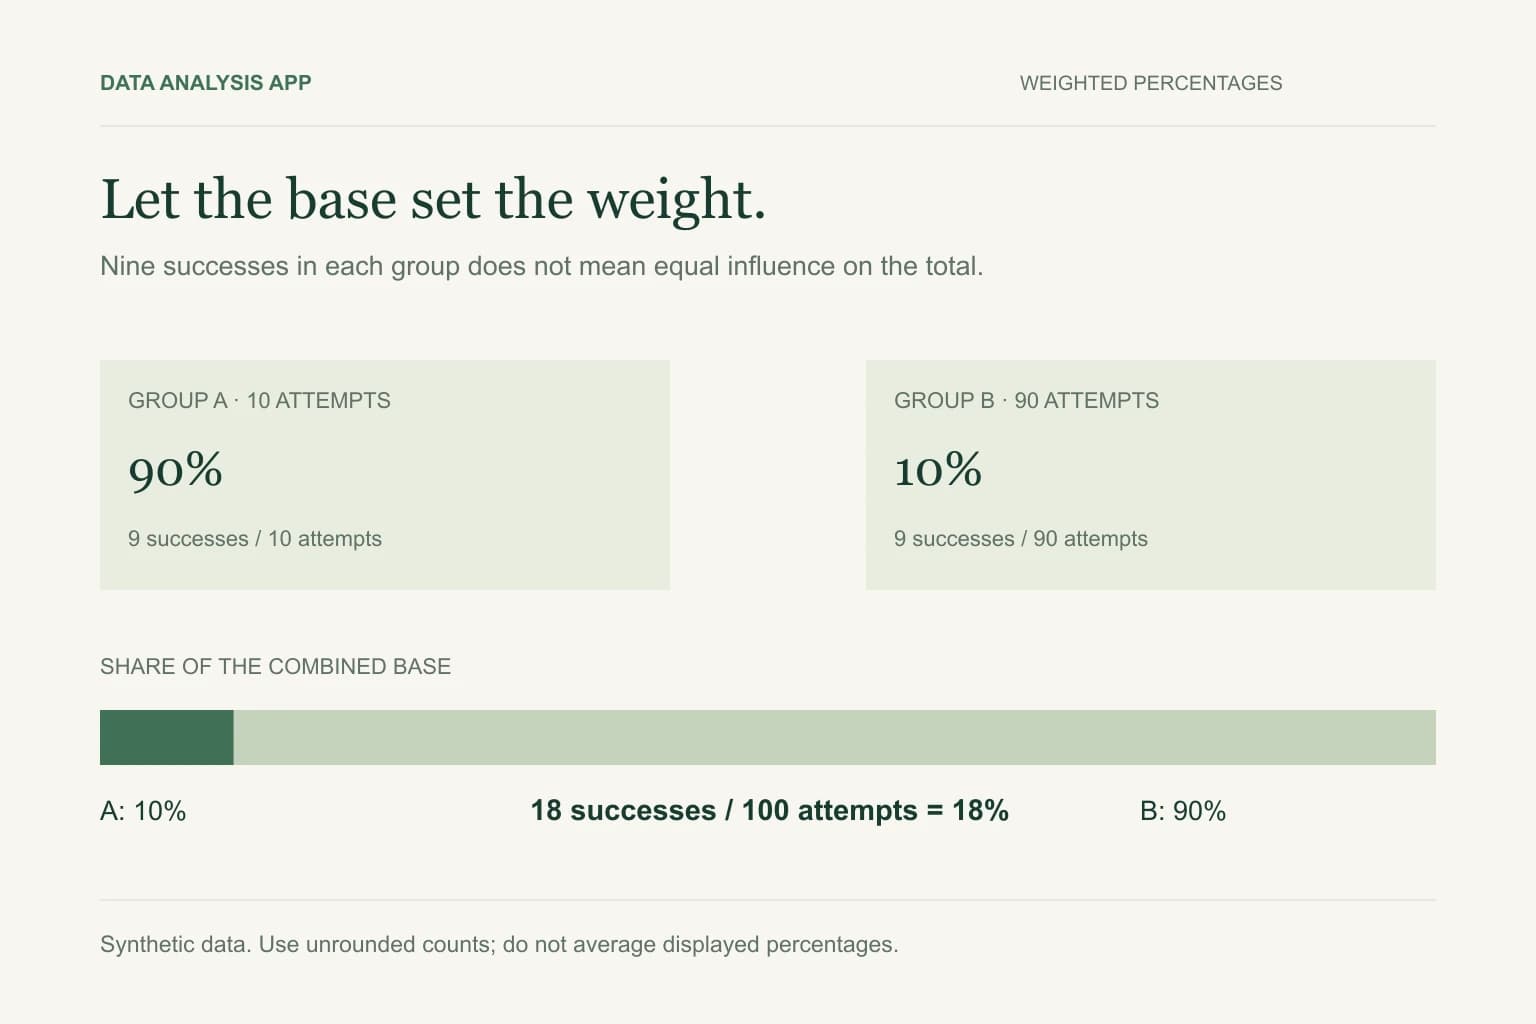
Choose the population first. The calculation then becomes straightforward, and the label can explain exactly whose experience the percentage represents. The following figures are synthetic and intended to make the denominator visible.
Download the synthetic rate example to reproduce both denominators in a spreadsheet.
Section 01
Start with counts when you have them
Campaign A records nine conversions from ten sessions. Campaign B records nine conversions from ninety sessions. Their conversion rates are 90% and 10%, but the combined rate is 18 divided by 100, or 18%. Averaging 90% and 10% produces 50%, which describes the mean of campaign-level rates instead of the conversion share of all sessions.
If conversions are in B2:B3 and sessions are in C2:C3, the overall rate is =SUM(B2:B3)/SUM(C2:C3). Format the result as a percentage. Check that each conversion count uses the same definition and attribution window and that the session groups do not overlap.
Section 02
Use SUMPRODUCT when only rates and bases are available
If rates are stored as numeric percentages in D2:D3 and their bases are in C2:C3, use =SUMPRODUCT(D2:D3,C2:C3)/SUM(C2:C3). Store 90% as 0.9, not as the number 90. Ensure both arrays cover the same rows and represent matched rate-base pairs.
Prefer counts over displayed rates when possible. A report showing 33% may represent one of three events, a rounded value of 33.333%, or an independently defined metric. Reconstructing counts from rounded percentages can introduce error. Retain full precision in the calculation and round only the final display.
Section 03
Match the weight to the business question
For conversion, the denominator might be eligible sessions. For average selling price, divide revenue by units. For a defect rate, divide defective items by inspected items. Revenue is not a universal weighting field merely because it is large or financially important.
Sometimes equal group weighting is deliberate. A manager may want the mean branch score with every branch treated equally, regardless of size. Label that statistic as an average across branches and show the spread. Do not present it as the experience of the average customer unless the underlying weighting supports that interpretation.
Section 04
Handle zero and missing bases explicitly
A group with no eligible sessions has no defined conversion rate. Label it unavailable, retain its zero base, and investigate why the population is empty. A missing base is different: the group may have activity that was not measured or exported. Omitting it silently makes the overall rate appear more complete than it is.
Before calculating, identify valid pairs where both numerator and denominator are known. Report excluded groups and their known activity separately. Do not use a broad error-catching formula to replace every failed division with zero; it can conceal broken references and malformed imports as well as legitimate empty populations.
Section 05
Avoid mixing incompatible populations
An overall rate assumes the groups can be combined meaningfully. A person appearing in two channel groups makes a user denominator nonadditive. Daily distinct users also cannot simply be summed into monthly distinct users. If the source provides a deduplicated overall metric, compare against that result instead of reconstructing it from overlapping groups.
Check time zones, date windows, eligibility rules, and currency where relevant. A weighted average is mathematically tidy even when its inputs are incompatible. Neither SUMPRODUCT nor a chart can detect every semantic mismatch for you.
Section 06
Check whether the overall result hides a reversal
A higher overall conversion rate does not prove that every campaign improved. Traffic can shift toward campaigns with higher existing rates while each individual campaign deteriorates. Compare rates within stable groups and show how their denominator shares changed alongside the overall number.
The PivotTable checking method covers why grand totals and row percentages may differ. For a decision document, show conversions, sessions, the resulting rate, and any exclusions together. To inspect your own prepared export, start a project and review those bases before relying on the summary or buying downloadable outputs.
See it on a real project
Three platforms claimed 8,412 conversions but described 4,318 orders. 2,580 of the claims were the same order counted again.
Keep reading
Evidence
Sources
- Microsoft (2026). Microsoft: weighted averages.
- Microsoft (2026). Microsoft: SUMPRODUCT.
- Data Analysis App team (2026). Related method: PivotTable totals.