Why does a PivotTable show the wrong total?
A PivotTable total can differ because the source range is incomplete, filters exclude records, numeric values are treated as text, or the aggregation does not match the metric. Reconcile the source first, inspect Sum versus Count, refresh the data, and calculate ratios from their underlying numerators and denominators.
Key numbers
- 2 groups
- different denominators
- 50%
- unweighted average of group rates
- 18%
- combined rate from 18 of 100
Key takeaways
- Check source coverage before changing formulas.
- Count and Sum answer different questions.
- A correct total ratio need not equal the average of displayed row percentages.
A PivotTable can look credible while summarizing only half of a source export. It can also show a grand total that differs from the visible row percentages for a mathematically valid reason. Start by identifying which kind of discrepancy you have.
Establish the records included, the metric being calculated, and the aggregation rule that answers the business question before changing the total.
Section 01
Reconcile the source before the pivot
Record the source row count and an independent amount total. Check whether the pivot points to a fixed cell range that excludes recently added rows. An Excel Table can make expanding data easier to manage, but still verify the actual source and refresh the PivotTable after changes.
Inspect filters, slicers, hidden categories, blank keys, and the period selected. A filtered result may be correct for its scope while being compared with an unfiltered control total. Write the intended period and inclusion rules beside both numbers before treating the difference as an error.
Section 02
Inspect the value field setting
Right-click the value field and inspect how it is summarized. Sum adds amounts; Count counts nonempty entries. Microsoft documents that nonnumeric values or blanks can affect the default aggregation. Do not assume that a field labeled Amount was automatically interpreted as a numeric amount throughout the import.
Check the source for currency symbols stored as text, unusual separators, empty strings from formulas, and error cells. The text-number method explains how to convert valid values without hiding failed conversions. Rebuild the source control total after the conversion, then refresh and recheck the pivot.
Section 03
Decide whether repeated rows are legitimate
Suppose order 1001 has three line items. Counting order_id returns three entries, while the business question may concern one order. Summing an order-level shipping charge repeated on each line also overstates shipping. The correct aggregation depends on the grain of the source table.
Where a distinct-order measure is needed, use a workflow that supports distinct counting or prepare a verified order-level table first. Do not delete repeated order IDs from a line-item table: doing so discards real products and revenue. Document which fields belong to the order and which belong to its lines.
Section 04
Calculate percentages from their bases
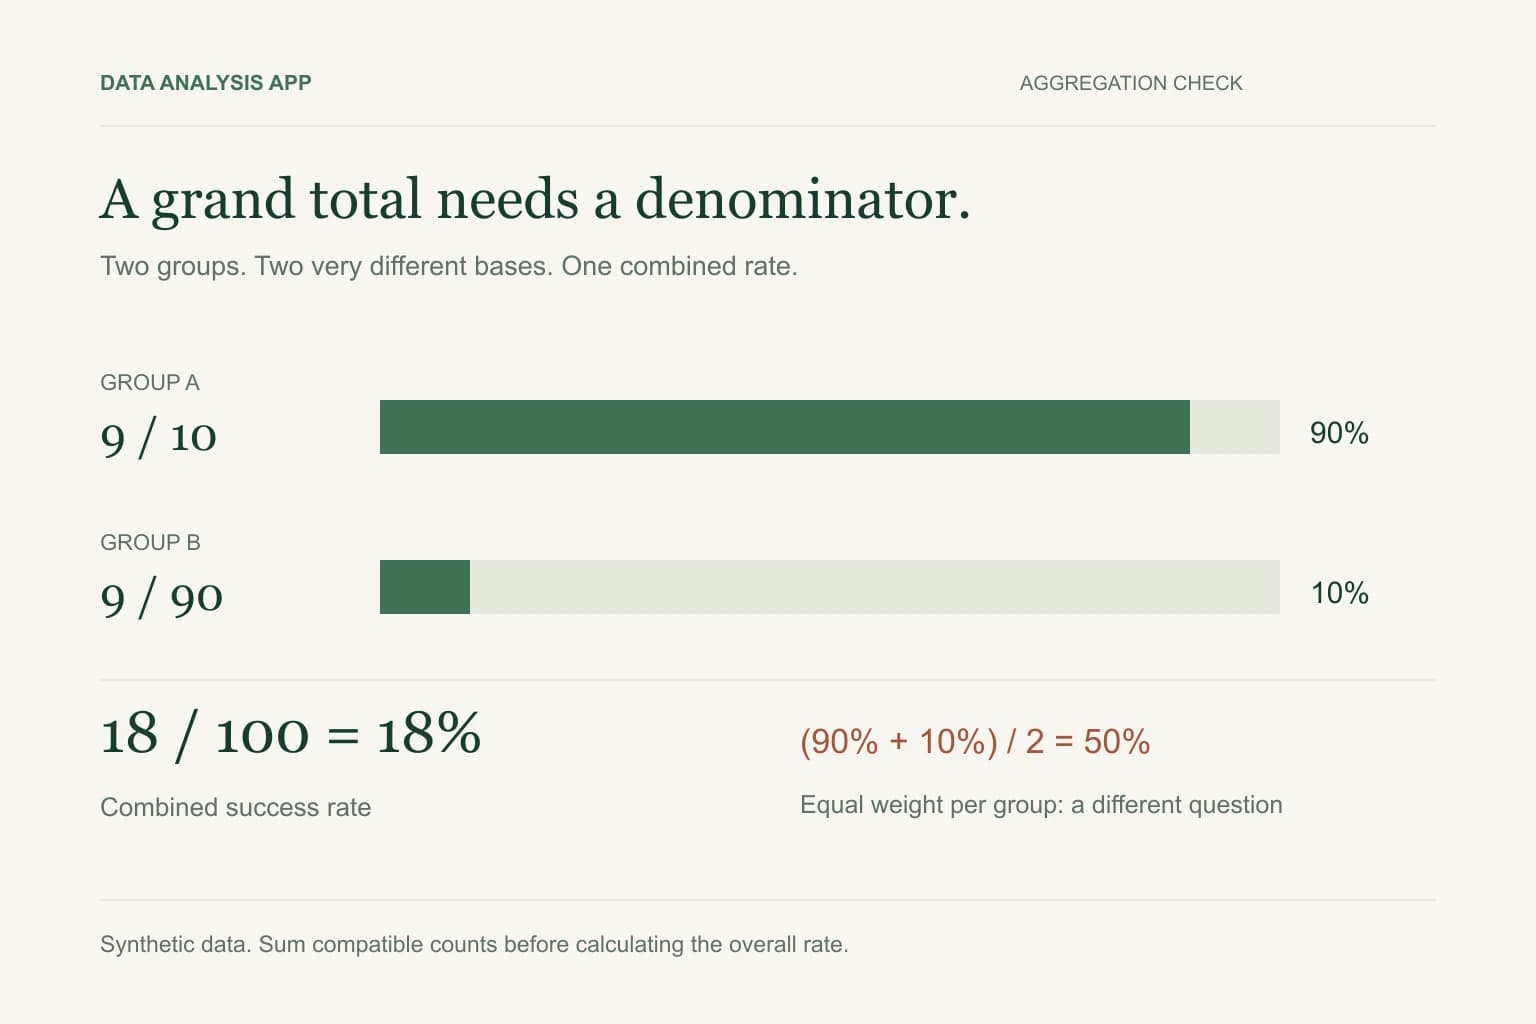
Consider two synthetic groups. Group A has nine successes from ten attempts: 90%. Group B has nine successes from ninety attempts: 10%. The average of the two percentages is 50%. The combined success rate is eighteen successes from one hundred attempts: 18%.
Both calculations are arithmetic results, but they answer different questions. The 50% figure gives equal weight to each group. The 18% figure gives equal weight to each attempt. For an overall attempt success rate, sum successes and attempts separately, then divide. The weighted-average guide develops the example further.
Section 05
Understand calculated grand totals
A calculated field can evaluate its formula using aggregated inputs rather than adding the displayed row calculations. That can be exactly what a ratio needs. Adding row margins, conversion rates, or average prices usually has no coherent interpretation.
Write a manual control calculation outside the pivot with the same filter scope. If the manual result agrees with the total but not the average of row ratios, investigate the denominator choice before changing the report. Do not round inputs to displayed percentages before calculating the final result.
Section 06
Make the reconciliation visible
Keep a short check panel: source rows, included rows, source amount, pivot amount, excluded amount, and the reason for any difference. A difference of zero should be the outcome of named controls, not a substitute for checking the correct population.
- Refresh after source changes and verify the latest period is included.
- Use an explicit label such as Total sales or Distinct orders.
- Show missing denominators as unavailable rather than zero percent.
- Recompute rates from additive base measures at each reporting level.
If you bring the source export into Data Analysis App, use the same control totals and metric definitions when reviewing findings. A second tool provides a useful comparison only when it receives the same records and answers the same question.
See it on a real project
Contractor spend rose $412,000 while headcount spend fell $448,000, leaving only a $4,000 net change.
Keep reading
Evidence
Sources
- Microsoft (2026). Microsoft: PivotTable aggregation.
- Microsoft (2026). Microsoft: calculated field grand totals.
- Data Analysis App team (2026). Worked method: weighted percentages.