How do you calculate an inventory reorder point?
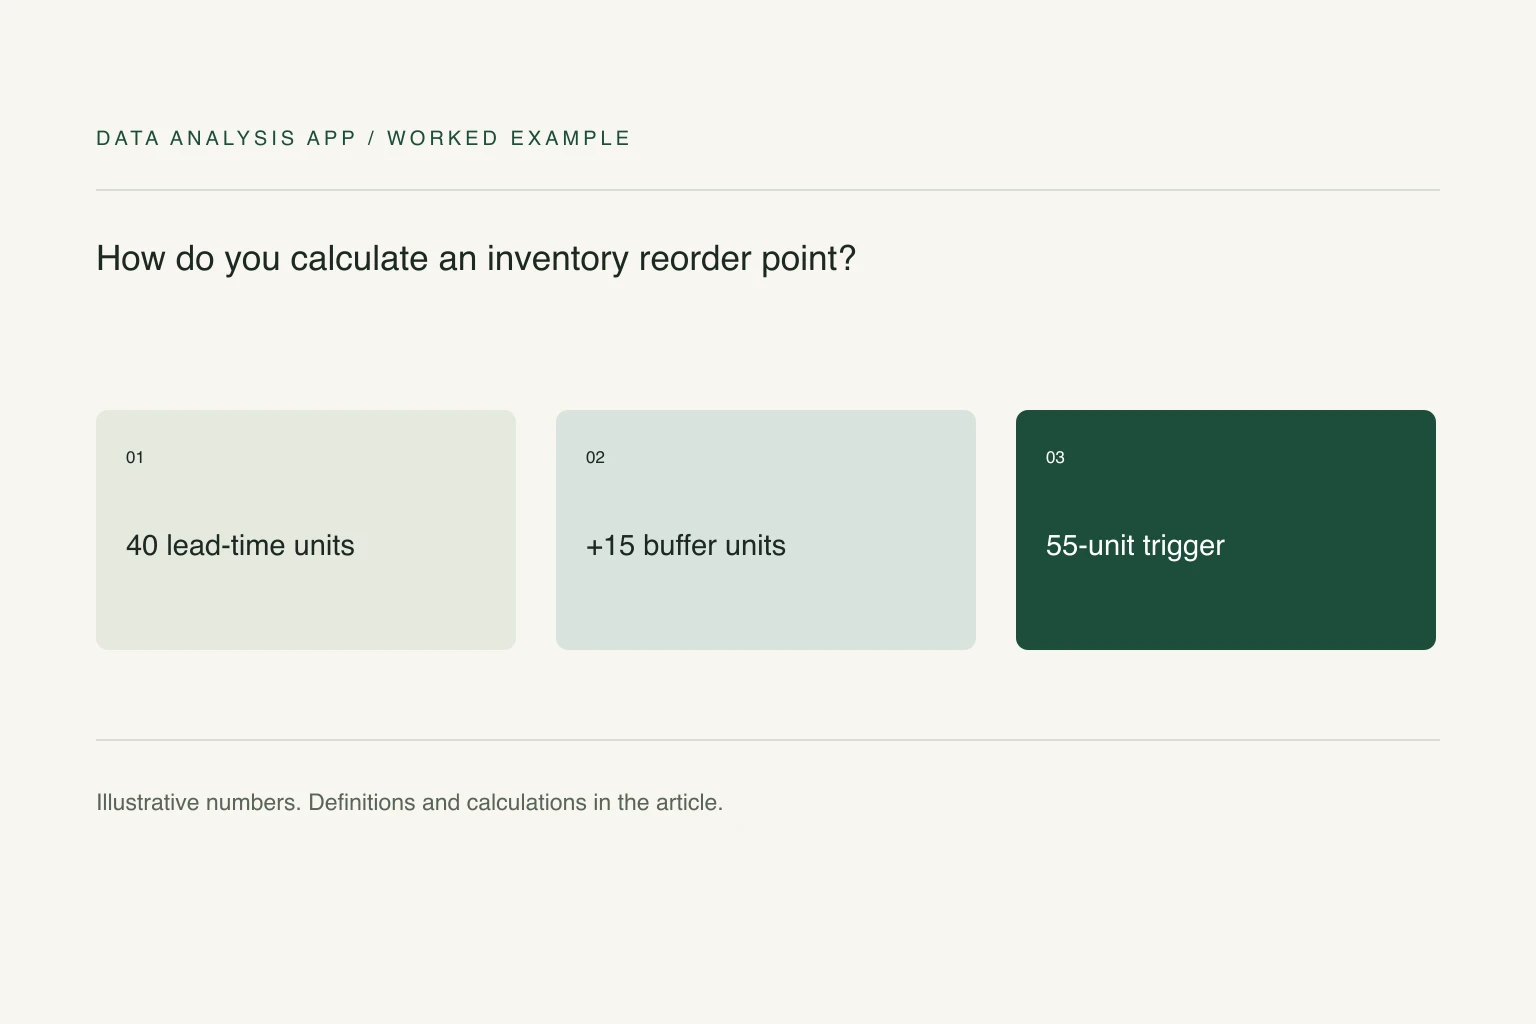
Multiply the planning rate of daily demand by replenishment lead time, then add an explicit safety-stock buffer. Compare the result with inventory position, accounting for sellable stock, allocations, and inbound orders. Check receipt timing and stockout-distorted sales history, and calculate the order quantity separately from the reorder trigger.
Key numbers
- 4/day
- example planning demand
- 10 days
- example replenishment lead time
- 55 units
- trigger including a 15-unit buffer
Key takeaways
- Keep units, locations, allocations, and inbound stock consistent.
- Sales during stockouts do not measure all unmet demand.
- A reorder trigger is different from an order quantity.
A reorder point answers when to order, not how much to buy. It combines expected demand while replenishment is in transit with a buffer for uncertainty. A rule that says order whenever stock falls below ten ignores how differently a fast-selling item and a slow-selling item behave.
The worked example is deliberately simple and uses fictional figures. It illustrates a planning calculation, not an optimized purchasing policy. Supplier reliability, demand patterns, cash constraints, shelf life, and minimum orders still require judgment.
Section 01
Keep the units and locations consistent
Build one row per SKU and stocking location. Record the demand window, units sold, days available, current sellable stock, allocated stock, open replenishment, and expected lead time. A case of twelve and a single unit cannot be summed until their units are reconciled. A warehouse's available stock may not be immediately available to another location.
Use sellable stock rather than physical count when some units are damaged or reserved. Keep returns distinguishable from fresh demand. Include an order only once, and separate cancelled lines. The inventory use case gives context for reviewing an export before turning it into a purchasing rule.
Section 02
Estimate demand from a meaningful window
Suppose an item sells 120 units over 30 days when it was available throughout. Its observed average is four units per day. If it was unavailable for ten of those days, dividing by all 30 days understates the rate while it was in stock. Dividing by 20 yields six units per available day, but even that estimate assumes those days are representative.
A promotion or holiday can violate that assumption. Keep the raw sales, availability days, and the selected planning rate in separate columns. Label a forecast as a forecast. Observed sales during a stockout cannot reveal the orders that customers would have placed if the item had been available.
Section 03
Calculate the trigger and explain the buffer
Using the four-unit rate, a ten-day replenishment lead time implies 40 units of expected lead-time demand. With an explicitly chosen 15-unit safety buffer, the reorder point is 55 units. Shopify's reorder-point guidance uses the same basic structure: lead-time demand plus safety stock.
The example's 15-unit buffer is a planning assumption, not a statistically calibrated service level. Do not describe it as providing a particular probability of avoiding stockout. Estimating that probability would need a model of lead-time and demand uncertainty, with assumptions checked against the available history.
Section 04
Compare the trigger with inventory position
Suppose there are 38 units on hand, eight allocated to existing orders, and 20 on a confirmed inbound order. Inventory position is 38 - 8 + 20 = 50 units. That is below the 55-unit reorder point, so it triggers a purchasing review under the stated rule. If inbound stock cannot arrive when needed, a single inventory-position number can hide a near-term shortage.
Keep expected receipt dates visible. A time-phased review may show that the item runs out before an already-ordered shipment arrives. Conversely, placing a duplicate order because an inbound shipment was omitted can create surplus. Check open purchase orders before translating an alert into a new commitment.
Section 05
Set an order quantity separately
The reorder point is not an instruction to order 55 units. An order quantity must account for the desired coverage horizon, existing orders, pack sizes, minimum quantities, storage, and expiry constraints. State those rules separately so a trigger does not silently become an order size.
Reconcile inventory movement against receipts, sales, returns, and adjustments. The messy CSV guide covers import checks that can change the calculation. Upload an export to review free findings, then validate the planning assumptions before purchasing stock. A checked dataset improves the decision; it does not remove uncertainty from future demand.
See it on a real project
$128,000 of stock had not sold in nine months, and half was bought to reach a supplier discount.
Keep reading
Evidence
Sources
- Shopify (2026). Reorder point formula and planning considerations.
- Data Analysis App team (2026). Related method: how to clean a messy csv file.
- Data Analysis App team (2026). Worked project: inventory cash.