Work out who is leaving, and from where.
- Formats accepted
- 16
- Stages
- 3
- Analysis behind it
- the full one
No account needed to start. You only pay when you like what you see.
- .xlsx. Excel workbook. Every sheet read, including the ones that are notes rather than data.
- .xls. Excel 97–2003. Read the same as a modern workbook.
- .xlsm. Excel, macro-enabled. Values and formulas are read. Macros are never executed.
- .ods. OpenDocument spreadsheet. LibreOffice and OpenOffice workbooks, read like Excel.
- .numbers. Apple Numbers. Tables are pulled out of the Numbers package sheet by sheet.
- .csv. CSV. Delimiter, quoting and encoding detected rather than assumed.
- .tsv. Tab-separated. Read as delimited text.
- .json. JSON. Nested objects are flattened into tables, keeping the path as the column name.
- .ndjson. Newline-delimited JSON. Streamed a record at a time, so an export of any size is fine.
- .xml. XML. Repeated elements become rows; attributes become columns.
- .parquet. Parquet. Read columnwise, with the file's own types kept.
- .sqlite. SQLite database. Every table read, with the foreign keys used to work out how they relate.
- .db. SQLite database. Read as SQLite when the file is one, and reported plainly when it is not.
- .txt. Plain text. Read as notes, or as data when the contents turn out to be a table.
- .md. Markdown. Markdown tables become tables; the rest becomes context for the analysis.
- .zip. Zip archive. Unpacked, and each file inside is treated as though you had uploaded it yourself.
What comes back
A finished project, rendered by the components that render your own.
The overtime is not spread across the team, and the people carrying it are the ones leaving.
Eleven people worked 6,884 of the year's 18,412 overtime hours, and nine of them are on the night rota. Seven of those eleven have since left. Separately, the 27% attrition the business reports is computed on closing headcount, which flatters a year in which headcount grew from 198 to 226; on average headcount the same 61 leavers give 28.8%. Seven in ten of them left inside their first year.
Most of the leaving happens in the first year
43 of 61 leavers were inside their first year
- 01Eleven people worked 37% of the overtime, and seven of them have left.
- 02Attrition is 28.8%, not the 27.0% currently reported.
- 03Seven in ten leavers went inside their first year.
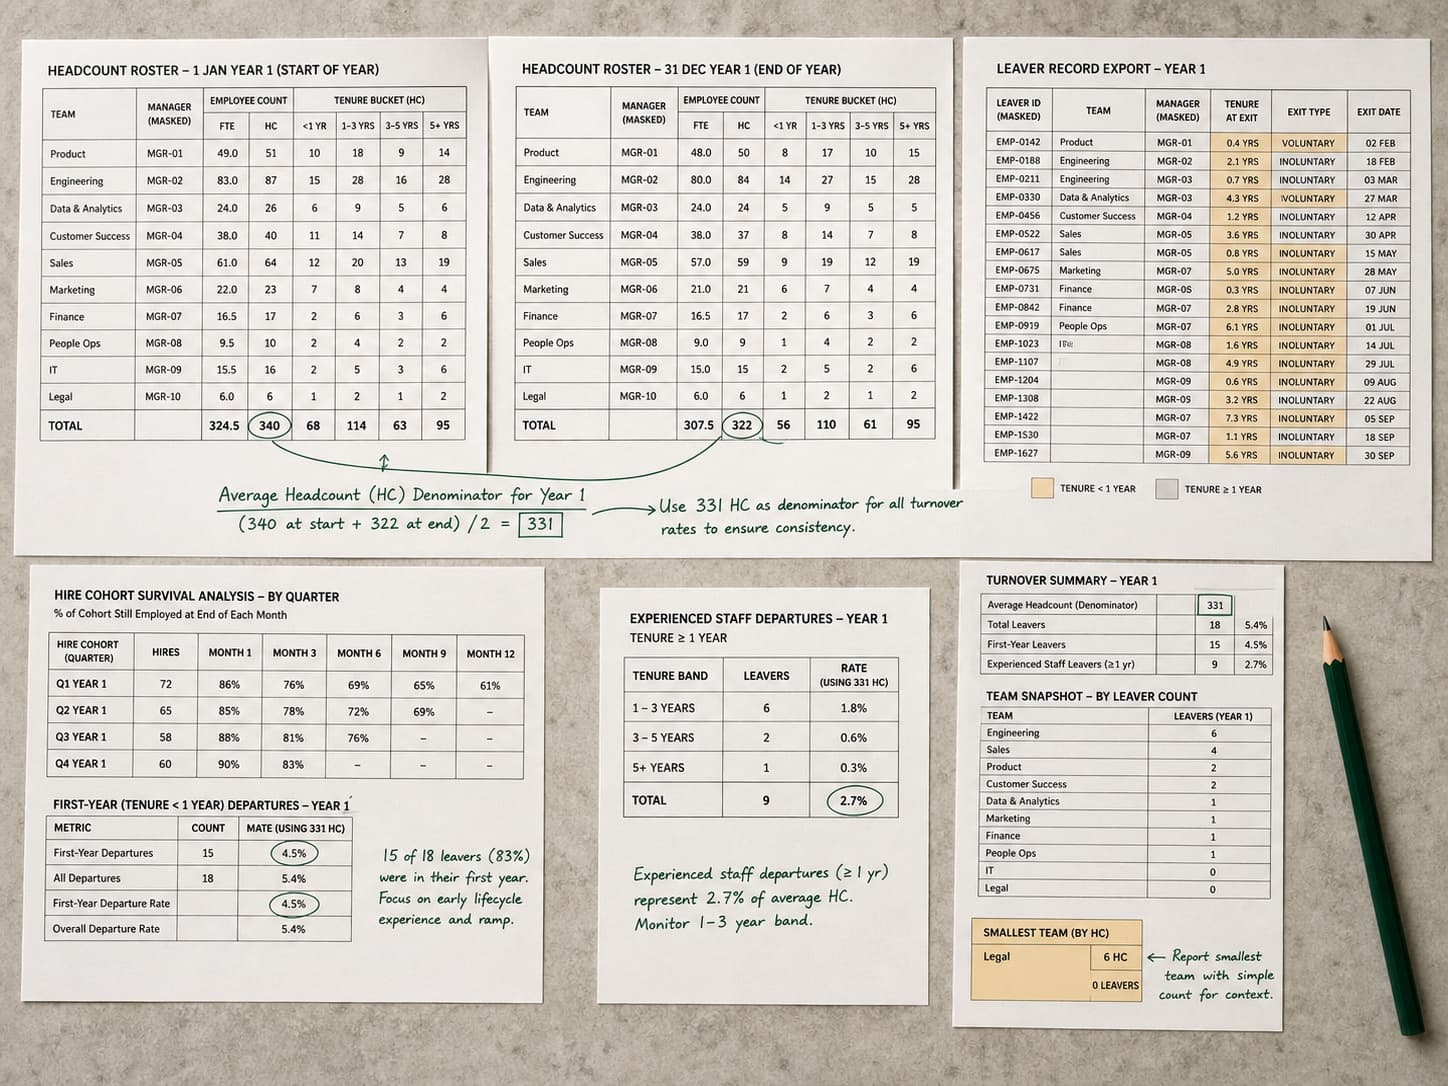
It fixes the denominator first
Attrition on opening headcount, on closing headcount and on average headcount give three different numbers, and comparing figures built on different denominators is the most common mistake in this analysis. One definition is chosen, written down, and used everywhere.
It splits by tenure before anything else
Most leaving happens early. An organisation losing people in their first year has a hiring or onboarding problem; one losing five-year veterans has a different problem entirely, and a single blended rate hides both.
It is careful with small teams
A team of six with one leaver is not a 17% attrition rate in any useful sense. Groups below the threshold are reported as counts, and a manager is never ranked on a number that one departure would have reversed.
It expects a mess.
Most files that arrive here have several tables on one sheet, a title block above the data, totals stranded in the middle of it, and dates in more than one format. That is the normal case, not the awkward one.
- Attrition with its denominator stated
- Splits by tenure, team, manager and reason
- Cohort survival from hire date
- Small groups reported as counts, not rates
| Order | Date | Customer | Amt |
|---|---|---|---|
| 10241 | 07/02/26 | John Smith | $84.00 |
| 10242 | 2 July 2026 | SARAH LOPEZ | $41.00 |
| 10242 | 2 July 2026 | SARAH LOPEZ | $41.00 |
| 10243 | 45840 | s. lopez | 41 |
| Not supplied | Not supplied | SUBTOTAL | $166.00 |
| 10244 | 2026-07-03 | Amara Osei | $127.50 |
Questions it works through
Run against every dimension, not the three you had time for.
- Are we losing new starters or experienced people?
- Which teams are losing more than the headline suggests?
- Is this year genuinely worse, or measured differently?
- How much of it is regretted?
Questions people ask
Before anybody has uploaded anything.
What if our leaver reasons are recorded inconsistently?
They always are. Free-text reasons are grouped into themes and shown against the structured field, and where the two disagree that disagreement is reported rather than resolved silently.
Can it compare us to a benchmark?
Only where the benchmark's definition is known, and it will say which definition it used. A published rate computed on a different denominator is not a comparison, it is a coincidence.
Is employee data safe here?
The analysis runs in code, not in a model, and columns that look like identifiers are masked before anything about your data is shown to a model. Files are deleted on the schedule you choose and nothing is used to train anything.
Keep going
The neighbouring jobs, and what happens to each file type this takes.
Upload headcount data
No account needed to start. You only pay when you like what you see.