Work out which dishes make money.
- Formats accepted
- 20
- Stages
- 3
- Analysis behind it
- the full one
No account needed to start. You only pay when you like what you see.
- .xlsx. Excel workbook. Every sheet read, including the ones that are notes rather than data.
- .xls. Excel 97–2003. Read the same as a modern workbook.
- .xlsm. Excel, macro-enabled. Values and formulas are read. Macros are never executed.
- .ods. OpenDocument spreadsheet. LibreOffice and OpenOffice workbooks, read like Excel.
- .numbers. Apple Numbers. Tables are pulled out of the Numbers package sheet by sheet.
- .csv. CSV. Delimiter, quoting and encoding detected rather than assumed.
- .tsv. Tab-separated. Read as delimited text.
- .pdf. PDF. Checked for a text layer first. A PDF written by software keeps its table structure; a scan is read as an image and told apart from the first kind.
- .docx. Word document. Tables are lifted out of the document; the prose around them is kept as context.
- .pptx. PowerPoint deck. Tables and the data behind native charts are read slide by slide.
- .rtf. Rich text. Tables extracted, formatting discarded.
- .png. PNG image. Screenshots of a dashboard or a table are read, and every figure is checked against the totals in the same image.
- .jpg. JPEG photo. A photograph of a printed report or a handwritten sheet is read into a table.
- .jpeg. JPEG photo. The same as .jpg.
- .heic. iPhone photo. Accepted as it comes off the phone. Safari usually hands it over as a JPEG.
- .webp. WebP image. Read like any other screenshot.
- .tiff. TIFF scan. Multi-page scans are read page by page.
- .txt. Plain text. Read as notes, or as data when the contents turn out to be a table.
- .md. Markdown. Markdown tables become tables; the rest becomes context for the analysis.
- .zip. Zip archive. Unpacked, and each file inside is treated as though you had uploaded it yourself.
What comes back
A finished project, rendered by the components that render your own.
The menu margin is 64.5%, not the 70.6% the recipe cards give.
The recipe cards were costed fourteen months ago and supplier prices have moved since. Recomputed against the current price list, with modifiers attached to the dishes they belong to and waste counted, contribution over six months is $78,168 lower than reported. Three of the sixty-two dishes sell below what they cost to make, all of them lunch items on a promotional price nobody revisited, and together they lost $2,141. Loaded fries, the second-best seller, contributes $3.10 a plate against $9.85 for the burger beside it.
Every category costs more than its recipe card says
Sides drift furthest: 76.4% reported, 64.1% real
- 01The recipe cards are fourteen months old and overstate margin by 6.1 points.
- 02Three dishes sell for less than they cost to make.
- 0311.4% of revenue is booked to modifier lines attached to no dish.
It joins the till to the recipe card
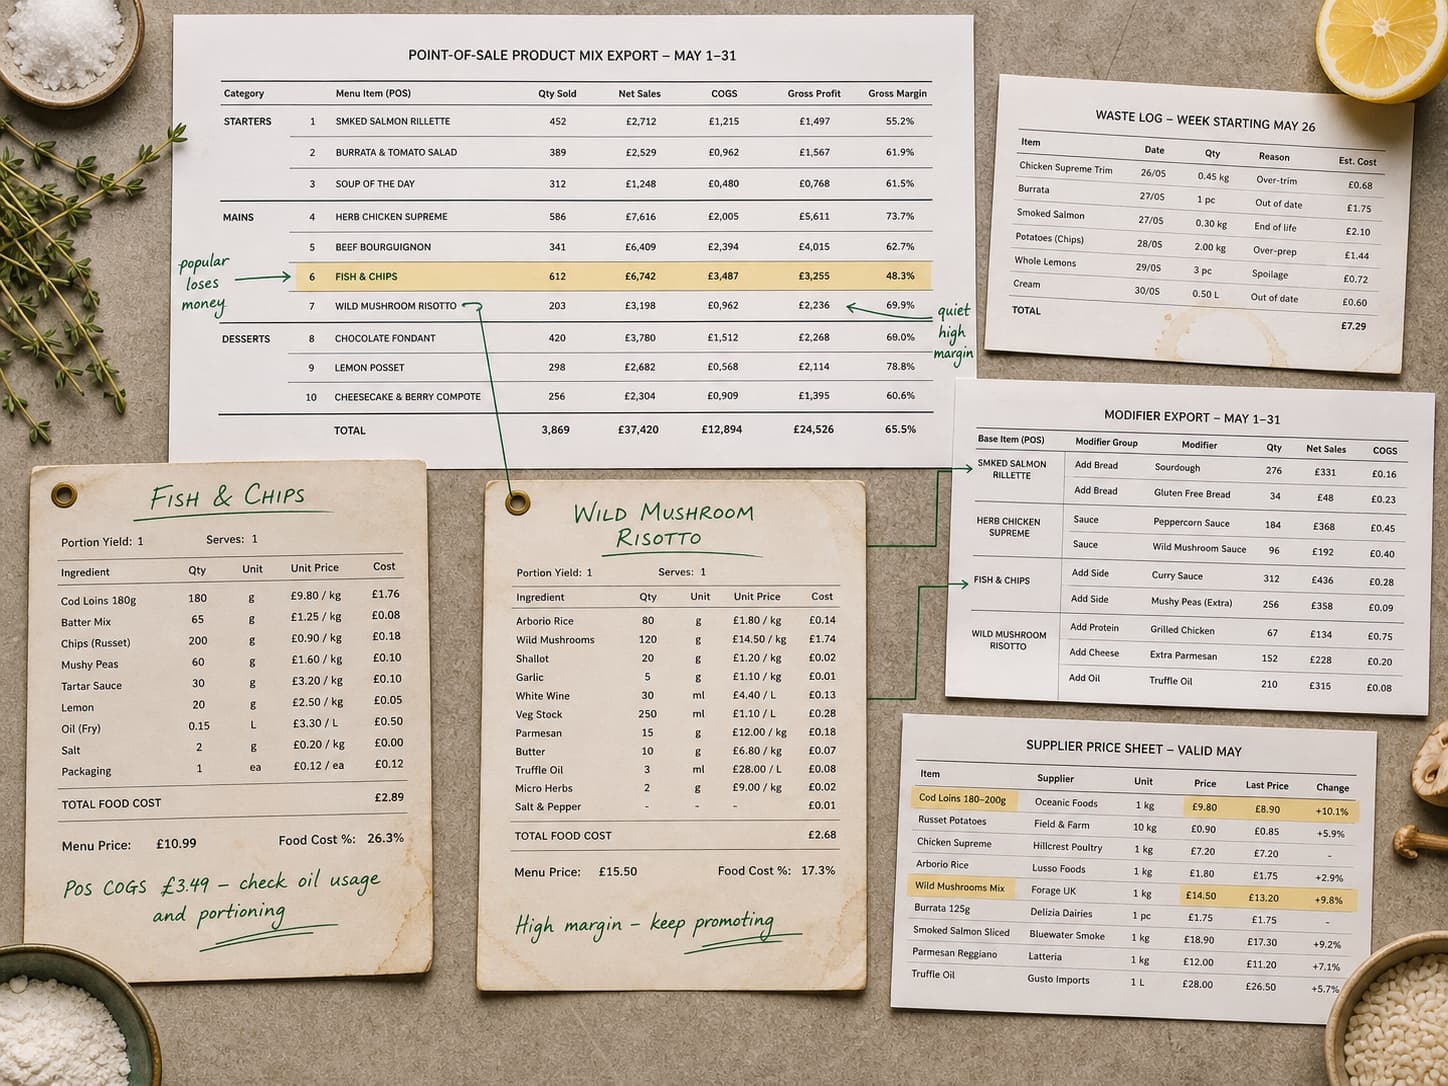
A product mix export knows what sold and a recipe sheet knows what it cost, and nothing joins them except a dish name written two ways. Matching them is most of the work and every uncertain match is shown rather than assumed.
It counts the modifiers
A burger with two dollars of additions has a different margin from the base item, and a till that records modifiers separately will hide that from every report you run. Modifiers are attached to the dish they belong to before any margin is computed.
It compares within category, not across the menu
Starters and mains live in different worlds of price and popularity, and ranking them together produces a matrix that recommends deleting every starter. Each category is engineered against itself.
It expects a mess.
Most files that arrive here have several tables on one sheet, a title block above the data, totals stranded in the middle of it, and dates in more than one format. That is the normal case, not the awkward one.
- Contribution per dish, including modifiers
- Popularity against margin, within each category
- Dishes that sell well and lose money
- Daypart differences, where the mix changes
| Order | Date | Customer | Amt |
|---|---|---|---|
| 10241 | 07/02/26 | John Smith | $84.00 |
| 10242 | 2 July 2026 | SARAH LOPEZ | $41.00 |
| 10242 | 2 July 2026 | SARAH LOPEZ | $41.00 |
| 10243 | 45840 | s. lopez | 41 |
| Not supplied | Not supplied | SUBTOTAL | $166.00 |
| 10244 | 2026-07-03 | Amara Osei | $127.50 |
Questions it works through
Run against every dimension, not the three you had time for.
- Which dishes are popular and unprofitable?
- What do the modifiers do to my margins?
- Which items should move on the menu, and which should leave it?
- Does lunch behave differently from dinner?
Questions people ask
Before anybody has uploaded anything.
What if my recipe costs are out of date?
Then the ranking is still useful and the absolute figures are not, and the analysis says which is which. Where a cost is stale enough to change a dish's classification, that dish is flagged specifically.
What if my POS does not track modifiers?
Then modifier revenue is reported as its own unattributed line rather than spread across dishes, and the limitation is stated wherever it affects a figure. Turning modifier tracking on is the single highest-value change you can make to this data.
Can it include labour?
Classic menu engineering deliberately stops at food cost. Where prep times exist, a version including them is produced alongside rather than instead, because the two answer different questions.
Keep going
The neighbouring jobs, and what happens to each file type this takes.
Upload POS and costs
No account needed to start. You only pay when you like what you see.