Find the stock that is not moving.
- Formats accepted
- 26
- Stages
- 3
- Analysis behind it
- the full one
No account needed to start. You only pay when you like what you see.
- .xlsx. Excel workbook. Every sheet read, including the ones that are notes rather than data.
- .xls. Excel 97–2003. Read the same as a modern workbook.
- .xlsm. Excel, macro-enabled. Values and formulas are read. Macros are never executed.
- .ods. OpenDocument spreadsheet. LibreOffice and OpenOffice workbooks, read like Excel.
- .numbers. Apple Numbers. Tables are pulled out of the Numbers package sheet by sheet.
- .csv. CSV. Delimiter, quoting and encoding detected rather than assumed.
- .tsv. Tab-separated. Read as delimited text.
- .pdf. PDF. Checked for a text layer first. A PDF written by software keeps its table structure; a scan is read as an image and told apart from the first kind.
- .docx. Word document. Tables are lifted out of the document; the prose around them is kept as context.
- .pptx. PowerPoint deck. Tables and the data behind native charts are read slide by slide.
- .rtf. Rich text. Tables extracted, formatting discarded.
- .json. JSON. Nested objects are flattened into tables, keeping the path as the column name.
- .ndjson. Newline-delimited JSON. Streamed a record at a time, so an export of any size is fine.
- .xml. XML. Repeated elements become rows; attributes become columns.
- .parquet. Parquet. Read columnwise, with the file's own types kept.
- .sqlite. SQLite database. Every table read, with the foreign keys used to work out how they relate.
- .db. SQLite database. Read as SQLite when the file is one, and reported plainly when it is not.
- .png. PNG image. Screenshots of a dashboard or a table are read, and every figure is checked against the totals in the same image.
- .jpg. JPEG photo. A photograph of a printed report or a handwritten sheet is read into a table.
- .jpeg. JPEG photo. The same as .jpg.
- .heic. iPhone photo. Accepted as it comes off the phone. Safari usually hands it over as a JPEG.
- .webp. WebP image. Read like any other screenshot.
- .tiff. TIFF scan. Multi-page scans are read page by page.
- .txt. Plain text. Read as notes, or as data when the contents turn out to be a table.
- .md. Markdown. Markdown tables become tables; the rest becomes context for the analysis.
- .zip. Zip archive. Unpacked, and each file inside is treated as though you had uploaded it yourself.
What comes back
A finished project, rendered by the components that render your own.
Your best-selling product loses $2.15 a unit, and it paid for the stock you cannot sell.
The linen shirt is the top seller by volume and reports a 59% gross margin. After discounts, marketplace and payment fees, free shipping and a 26% return rate, it contributes −$2.15 per unit ordered: $8,988 over the year. Meanwhile $128,000 of stock, 31% of the total value, has not sold in nine months, and eight of the products that do sell were out of stock for 4.7% of the year.
Where the linen shirt's margin goes
A 59% gross margin ends at −$8,988
- 01The best seller contributes −$2.15 per unit ordered.
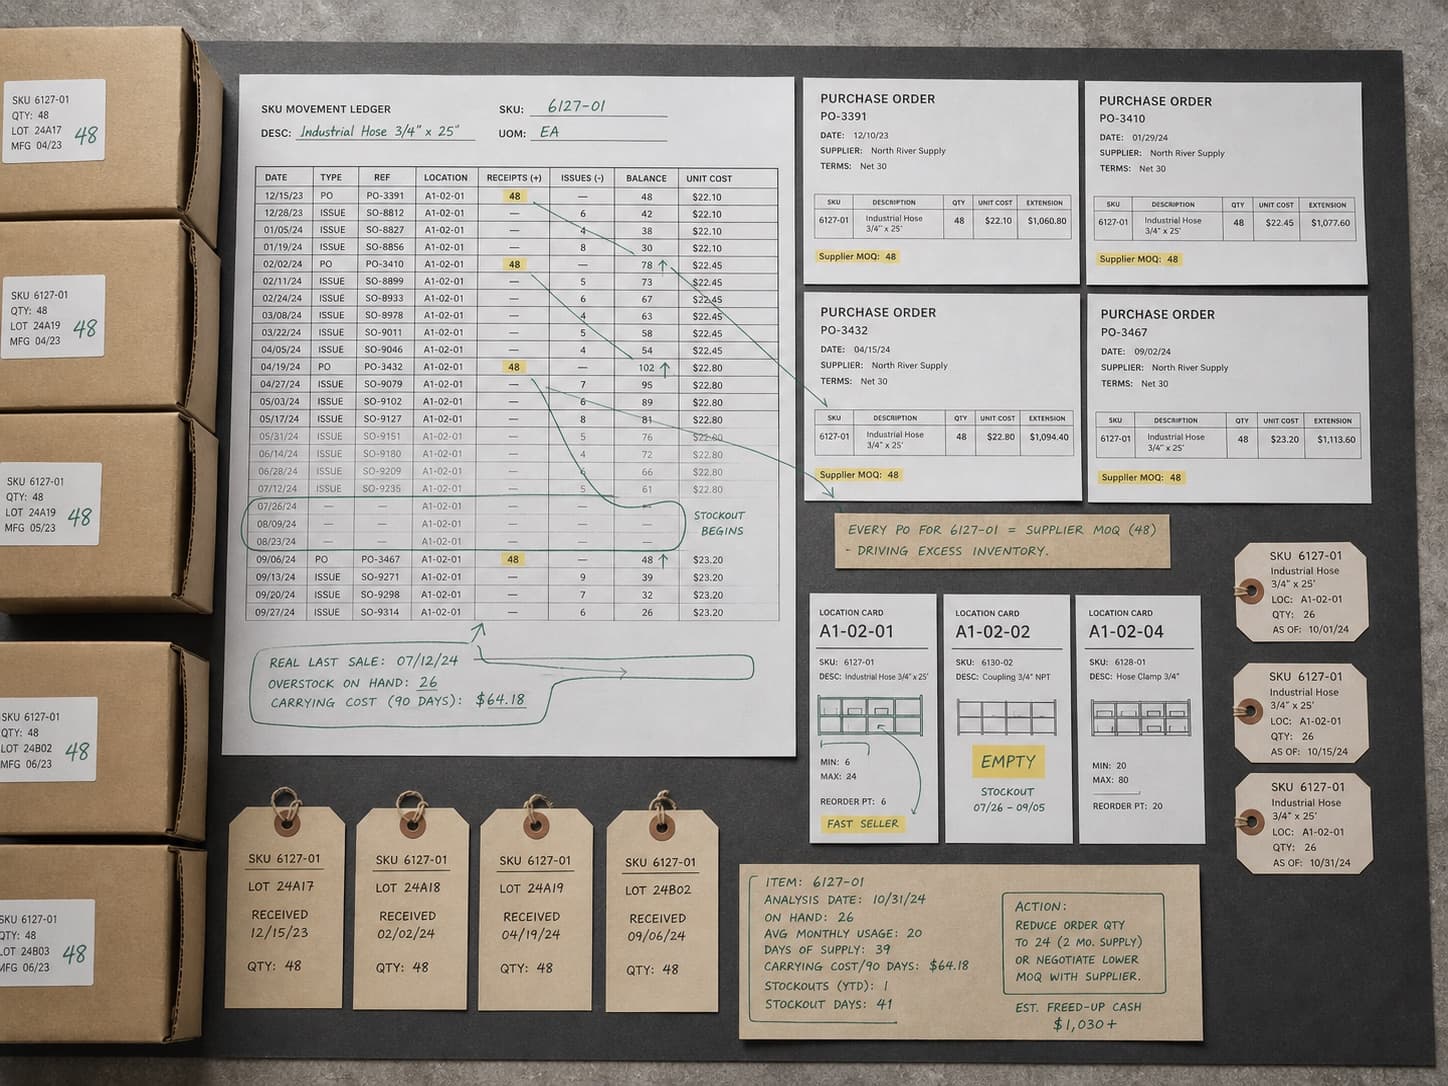
- 02$128,000 of stock has not sold in nine months, and half of it was bought to hit a discount.
- 03Eight products that do sell were unavailable for 4.7% of the year.
It ages stock on sales, not on the stock sheet
Stock files carry a `last_sold` column that is almost always stale, and always stale in the flattering direction. Ageing is rebuilt from the order lines: in the worked example the sheet's own column disagrees for 312 SKUs and would have classified $47,000 of dead stock as active.
It reconstructs the stockouts
A stockout leaves no rows. Nothing is recorded on the days you had nothing to sell. Zero-stock windows are found in the movement history and valued at the SKU's own rate of sale either side, then re-run at a deliberately conservative rate so you can see the range rather than one confident number.
It traces dead stock back to the decision
Knowing which stock is dead is a stocktake. Knowing why is analysis: half the dead value in the example arrived on four purchase orders where the quantity was set by a supplier's minimum rather than by demand. One of them was 480 units of a product that has sold 96 in fourteen months.
It expects a mess.
Most files that arrive here have several tables on one sheet, a title block above the data, totals stranded in the middle of it, and dates in more than one format. That is the normal case, not the awkward one.
- Stock aged by its real last sale
- Dead stock ranked by the cash clearing it releases
- Stockouts, with an estimate and its range
- ABC classification, and where the attention is going instead
- Cleaned .xlsx and methodology
| Order | Date | Customer | Amt |
|---|---|---|---|
| 10241 | 07/02/26 | John Smith | $84.00 |
| 10242 | 2 July 2026 | SARAH LOPEZ | $41.00 |
| 10242 | 2 July 2026 | SARAH LOPEZ | $41.00 |
| 10243 | 45840 | s. lopez | 41 |
| Not supplied | Not supplied | SUBTOTAL | $166.00 |
| 10244 | 2026-07-03 | Amara Osei | $127.50 |
Questions it works through
Run against every dimension, not the three you had time for.
- How much cash is sitting in stock that will not sell?
- Which of my best products ran out, and for how long?
- What did I buy because of a supplier minimum rather than demand?
- What do I have to discount, and by how much, to clear it in 60 days?
Questions people ask
Before anybody has uploaded anything.
Do I need a proper inventory system export?
No. A stock file with quantities and costs, plus sales history, is enough to age stock and rank it. Movement history makes stockouts measurable and purchase orders make the cause traceable: each extra file adds a section rather than being a prerequisite.
How does it know something was out of stock?
From the movement history, not from the absence of sales: those look identical and mean different things. Zero-stock windows shorter than two days are ignored as stock-count lag. With no movement history it reports what it cannot measure instead of inferring it.
Is the lost-sales figure real money?
It is an estimate of something that did not happen, and it is labelled that way everywhere it appears. It overstates in one direction, customers who bought another size are counted as lost, and understates in the other, since customers who left for good are not counted at all. Both are stated, and a conservative version is shown beside it.
What about seasonal stock?
A SKU that sold in the same month last year is excluded from the dead set rather than condemned for a quiet summer. That exclusion is listed, with the SKUs it applied to, so you can disagree with it.
Keep going
The neighbouring jobs, and what happens to each file type this takes.
Upload stock and sales
No account needed to start. You only pay when you like what you see.