Find out where the ad budget went.
- Formats accepted
- 21
- Stages
- 3
- Analysis behind it
- the full one
No account needed to start. You only pay when you like what you see.
- .xlsx. Excel workbook. Every sheet read, including the ones that are notes rather than data.
- .xls. Excel 97–2003. Read the same as a modern workbook.
- .xlsm. Excel, macro-enabled. Values and formulas are read. Macros are never executed.
- .ods. OpenDocument spreadsheet. LibreOffice and OpenOffice workbooks, read like Excel.
- .numbers. Apple Numbers. Tables are pulled out of the Numbers package sheet by sheet.
- .csv. CSV. Delimiter, quoting and encoding detected rather than assumed.
- .tsv. Tab-separated. Read as delimited text.
- .json. JSON. Nested objects are flattened into tables, keeping the path as the column name.
- .ndjson. Newline-delimited JSON. Streamed a record at a time, so an export of any size is fine.
- .xml. XML. Repeated elements become rows; attributes become columns.
- .parquet. Parquet. Read columnwise, with the file's own types kept.
- .sqlite. SQLite database. Every table read, with the foreign keys used to work out how they relate.
- .db. SQLite database. Read as SQLite when the file is one, and reported plainly when it is not.
- .pbix. Power BI report. The tables inside the report are read out of its model, along with the measures that were defined on top of them, so your own definitions are used rather than re-invented.
- .pbit. Power BI template. A template carries the model and the measures without the data, and is read for both.
- .twbx. Tableau packaged workbook. The packaged extract is read as data, and the workbook beside it supplies the calculated fields.
- .twb. Tableau workbook. Calculated fields and the shape of each sheet are read.
- .hyper. Tableau extract. Read straight through, table by table.
- .txt. Plain text. Read as notes, or as data when the contents turn out to be a table.
- .md. Markdown. Markdown tables become tables; the rest becomes context for the analysis.
- .zip. Zip archive. Unpacked, and each file inside is treated as though you had uploaded it yourself.
What comes back
A finished project, rendered by the components that render your own.
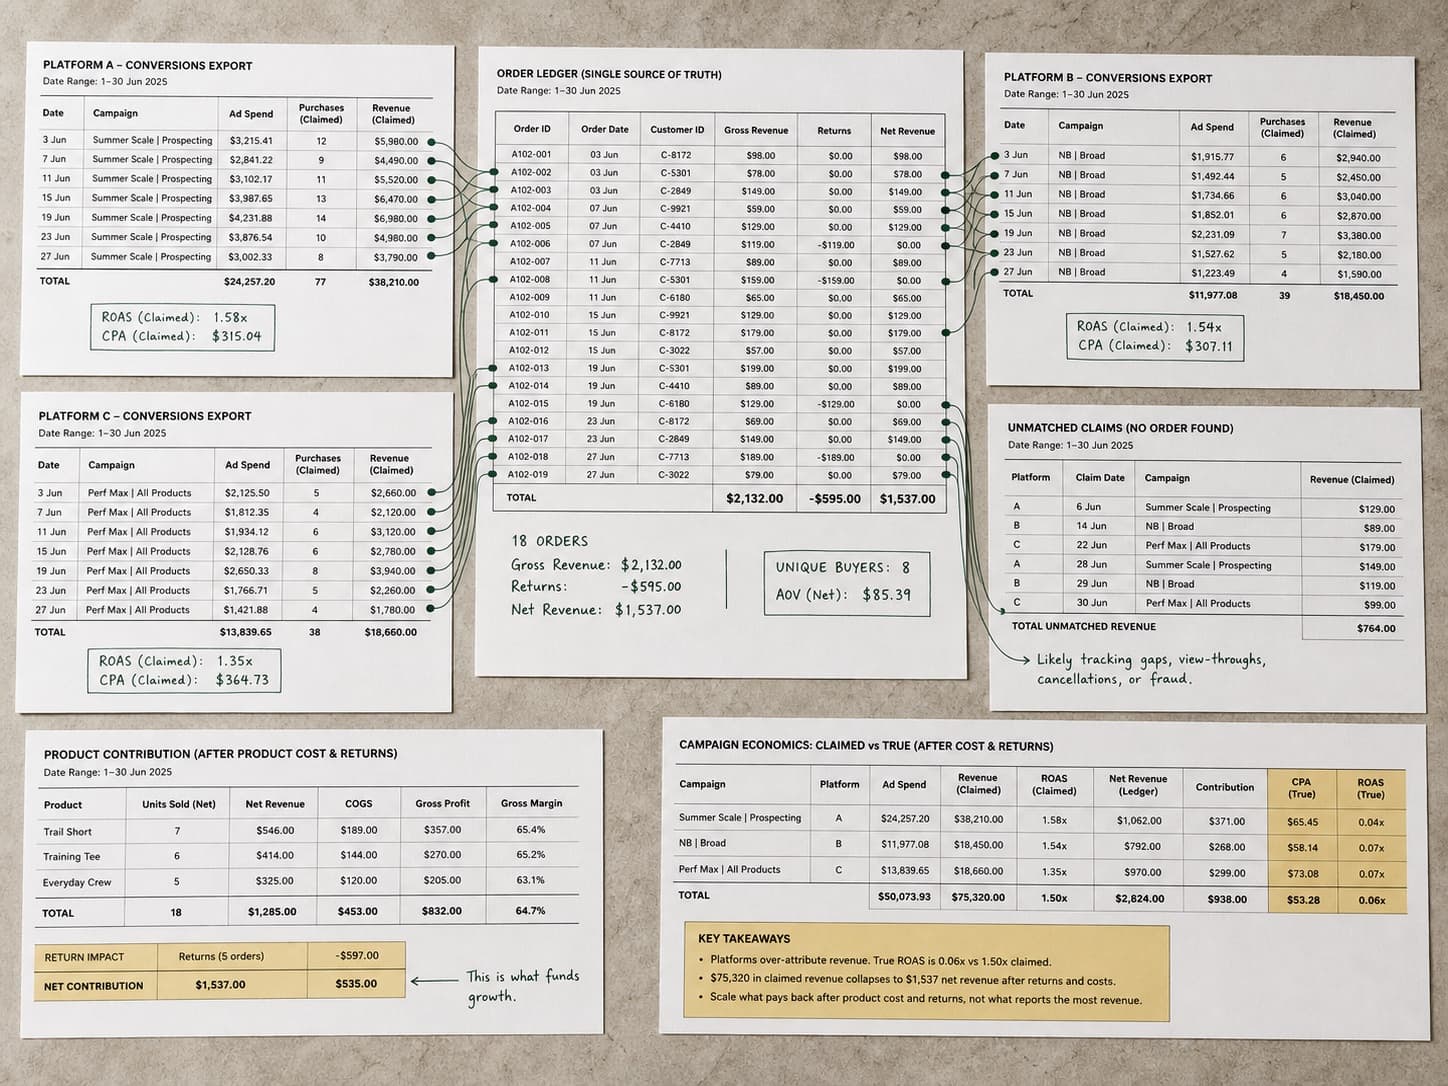
Three platforms claim 8,412 conversions. They describe 4,318 orders.
Nobody is lying and the numbers still do not add up: each platform counts a conversion inside its own attribution window, so a customer who saw two ads is claimed by both. 2,580 of the claims are the same order counted again, and a further 1,514 match no order at all. Reconciled, the cheapest channel becomes the most expensive: TikTok reports $39.34 a conversion and costs $128.40 an order. Set against contribution rather than revenue it loses $35,714 over the six months, because a quarter of what it sells comes back.
What each platform claimed, and what it can be traced to
8,412 claimed against 4,318 distinct orders
- 012,580 of the 8,412 claims are the same order counted again.
- 02TikTok is the cheapest channel on its own numbers and the most expensive on yours.
- 03TikTok loses $35,714 once returns and product cost are taken off.
It adds up what the platforms claim
Each platform counts a conversion by its own attribution window, so the same customer is claimed more than once and the totals exceed the orders that exist. The first number this produces is the size of that gap.
It reconciles claims to orders
Platform conversions are matched against your own order records, so a channel is credited with what it can be traced to rather than with what it reports. Every unmatched claim is counted and shown rather than dropped.
It reports cost against contribution, not revenue
Revenue per channel flatters whichever one sells the discounted, high-return products. Where product costs are present, spend is set against contribution instead, which is the number that decides whether a campaign is worth running.
It expects a mess.
Most files that arrive here have several tables on one sheet, a title block above the data, totals stranded in the middle of it, and dates in more than one format. That is the normal case, not the awkward one.
- Claimed conversions against matched orders, by channel
- Real cost per acquisition, with the double counting removed
- Spend against contribution rather than revenue
- Every unmatched claim, counted
| Order | Date | Customer | Amt |
|---|---|---|---|
| 10241 | 07/02/26 | John Smith | $84.00 |
| 10242 | 2 July 2026 | SARAH LOPEZ | $41.00 |
| 10242 | 2 July 2026 | SARAH LOPEZ | $41.00 |
| 10243 | 45840 | s. lopez | 41 |
| Not supplied | Not supplied | SUBTOTAL | $166.00 |
| 10244 | 2026-07-03 | Amara Osei | $127.50 |
Questions it works through
Run against every dimension, not the three you had time for.
- How many of these conversions are the same customer counted twice?
- What is my real cost per order on each channel?
- Which campaigns look profitable only because of the attribution window?
- Is the channel that reports the best return actually selling the worst products?
Questions people ask
Before anybody has uploaded anything.
Do I need a tracking tool for this?
No. This runs on exports you already have: the platform's own report and your order data. It cannot tell you what a customer saw, and it does not pretend to. It tells you how far the claims are from the orders, which is the question the dashboards are quietly avoiding.
Which platforms does it take?
Any that export a spreadsheet, which is all of them. Column names differ by platform and by year, so they are matched by content rather than by an expected header.
What if my orders have no channel field?
Then attribution is matched on time and value, which is weaker, and the analysis says so rather than presenting the same confidence on worse evidence.
Keep going
The neighbouring jobs, and what happens to each file type this takes.
Upload ad and order exports
No account needed to start. You only pay when you like what you see.