What causes the spreadsheet errors that cost organizations millions?
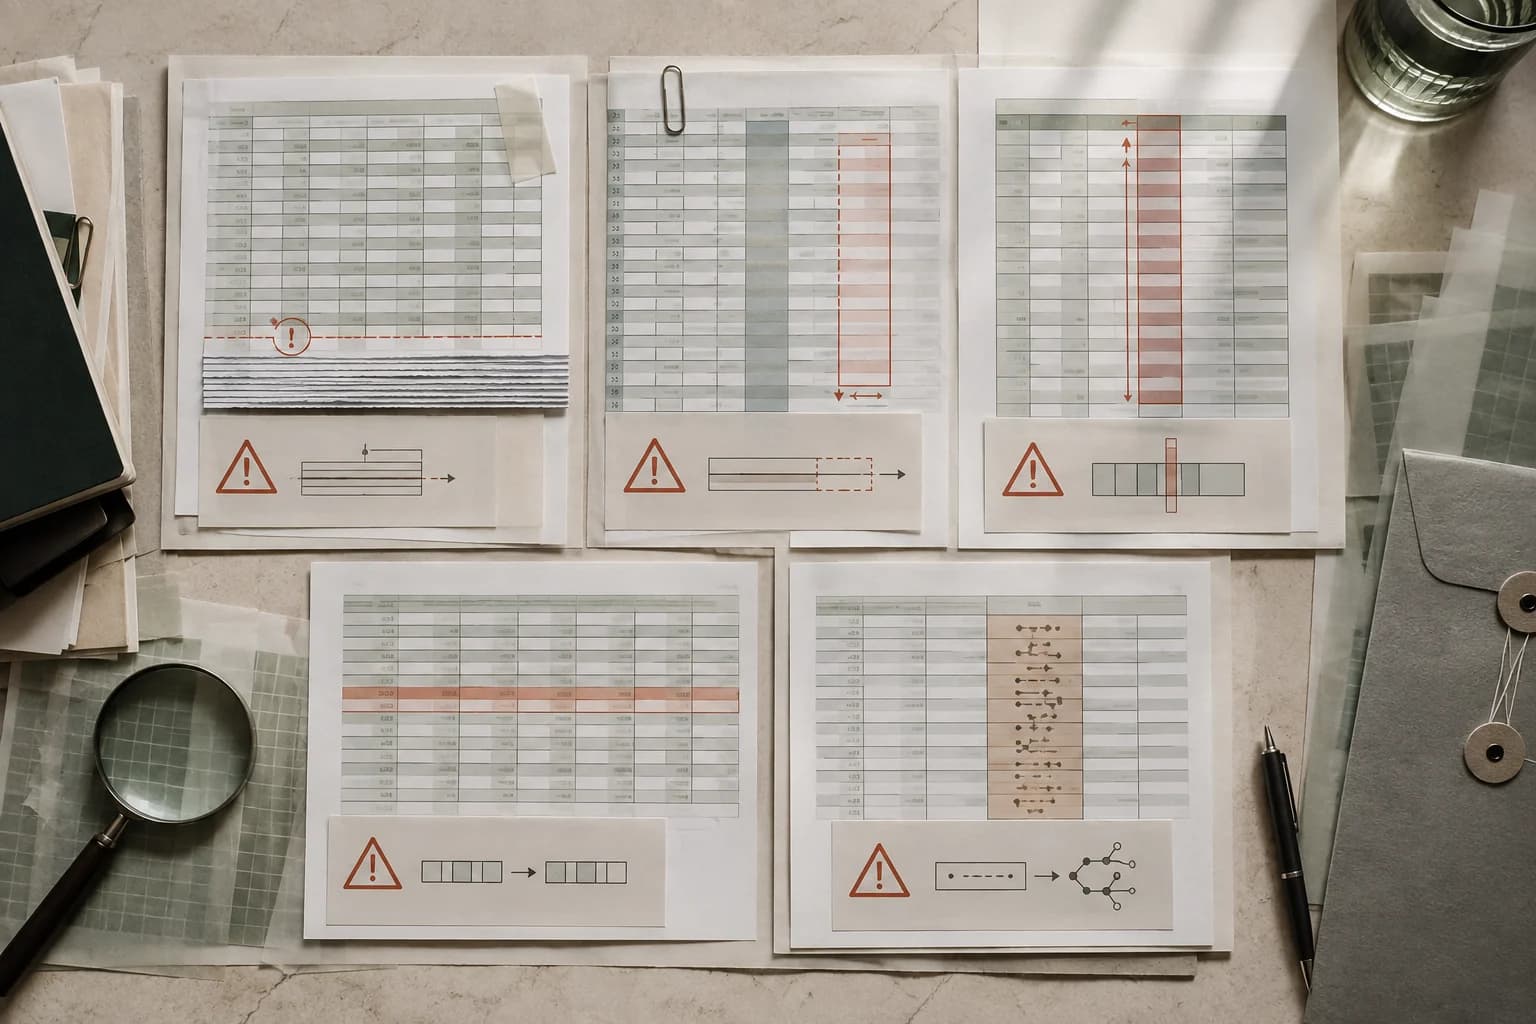
The best-documented spreadsheet disasters were structural, not arithmetic: silent row limits, formula ranges that stopped short, one-column sorts, copied inputs, and automatic type conversion. Rechecking the same formula does not catch those failures. Row-count reconciliation, declared data types, boundary checks and an independent recomputation of the important figure do.
Key numbers
- 65,536
- rows in the obsolete Excel format behind the COVID truncation
- $6.2bn
- minimum London Whale trading loss reported by the US Senate
- 30.9%
- supplementary gene lists affected by conversion errors in a 2021 audit
Key takeaways
- The famous failures were structural: wrong ranges, types, rows, and sort boundaries.
- Rechecking the same formula cannot catch an input or boundary mistake shared by that formula.
- Row reconciliation, declared types, boundary tests, and independent computation are cheap controls.
Not one of the well-documented spreadsheet disasters happened because somebody added up wrong. Every one of them was structural: a limit that was silently exceeded, a range that drifted, a value that was quietly converted into something else, or a figure that nobody ever recomputed independently.
That matters, because it means the usual remedies do not help. Checking the maths again finds nothing. The error is not in the arithmetic; it is in what the arithmetic was performed on.
Five cases below, all publicly documented and each linked to its source, then what they have in common. Some widely repeated stories are not here, for reasons given at the end.
Section 01
Public Health England lost 15,841 COVID cases to a row limit
In October 2020, Public Health England discovered that positive test results were missing from the national contact-tracing pipeline. The number was 15,841 cases, covering the period from 25 September to 2 October 2020.
The cause was the file format. Test results arrived from commercial laboratories as CSV files and were collated into Excel workbooks saved in the older .xls format, which holds a maximum of 65,536 rows per sheet. Because each test result occupied several rows, the practical ceiling was roughly 1,400 cases per file. When a file filled up, the remaining records were not written. Nothing errored. The rows beyond the limit simply were not there, so those cases were never counted and their contacts were never traced. The Register's account sets out the mechanism and PHE's statement at the time.
The remedy adopted was to split the data across more files. The row limit does not exist in the modern `.xlsx` format, which holds 1,048,576 rows, but the deeper problem is not the size of the ceiling. It is that hitting a ceiling produced no signal at all.
Section 02
JPMorgan's Value-at-Risk model ran on copied-and-pasted spreadsheets
The US Senate Permanent Subcommittee on Investigations put the losses from JPMorgan's 2012 "London Whale" trades at at least $6.2 billion. The bank's own Management Task Force report examined how the risk model failed to show the exposure, and the answer was partly a spreadsheet.
The report described a model built from several Excel spreadsheets, with data copied and pasted between them and formulas and inputs completed manually. That made the process slow and increased the opportunity for error. Forbes reported the finding shortly after the report was published.
One of the errors was specific. Having subtracted the old rate from the new rate, the spreadsheet divided by their sum rather than their average, which is what the modeller had intended. AccountingWEB's account says the mistake likely halved the volatility shown and lowered the value-at-risk figure.
A model that halves the volatility it reports does not look broken. It looks like a portfolio that is behaving well.
Section 03
A formula range that stopped five rows short changed an economic argument
Carmen Reinhart and Kenneth Rogoff's 2010 paper Growth in a Time of Debt reported that countries with public debt above 90 per cent of GDP saw average real growth of -0.1 per cent. The figure was widely cited in arguments for austerity.
In 2013, Thomas Herndon, Michael Ash and Robert Pollin at the University of Massachusetts Amherst obtained the original spreadsheet and published a replication. They identified three problems: selective exclusion of available years, an unconventional weighting of country averages, and a spreadsheet coding error in which an averaging formula's range stopped five rows early, omitting Australia, Austria, Belgium, Canada and Denmark from the calculation.
Correcting all three produced average growth of 2.2 per cent for the same debt category rather than -0.1 per cent. The sign changed. So did the conclusion.
The formula error alone did not account for the whole gap, and it is worth being precise about that, but the range that stopped short is the part that could have been caught by anyone who checked which rows the formula covered.
Section 04
Roughly a fifth of genomics papers contained gene names Excel had turned into dates
In 2016, Mark Ziemann, Yotam Eren and Assam El-Osta screened 35,175 supplementary Excel files attached to papers in 18 journals between 2005 and 2015. They found 7,467 gene lists across 3,597 papers, and gene name conversion errors in 987 files belonging to 704 articles: about a fifth of papers with an Excel gene list.
The mechanism is autocorrection. The gene symbol SEPT2 becomes the date "2-Sep". MARCH1 becomes "1-Mar". RIKEN identifiers such as 2310009E13 are read as scientific notation and become floating point numbers. Excel applies these conversions on open, on paste and on typing, and it does so without a prompt.
A follow-up by Abeysooriya, Soria, Kasu and Ziemann in 2021 screened 166,139 articles and found the rate had risen to 30.9 per cent of articles with supplementary gene lists. The eventual fix came from the other direction: the gene nomenclature committee renamed the affected genes, so SEPT1 is now SEPTIN1 and MARCH1 is now MARCHF1. The software did not change. The genes did.
This is the clearest example on the list of a spreadsheet silently deciding what a value means, which is the same behaviour described in why Excel changes my numbers and, in its most costly everyday form, in how to fix dates in a spreadsheet.
Section 05
TransAlta paid $24 million for a misaligned paste
In 2003, the Canadian power company TransAlta submitted bids for transmission congestion contracts in New York with the bids and the prices misaligned by one row. The company bought more contracts, at higher prices, than it had intended, and the error was found only after the bids had been submitted and could not be withdrawn.
The Globe and Mail reported the cost at $24 million, around a tenth of the company's annual profit. Chief executive Steve Snyder said the mistake came from copying and pasting in Excel and survived the final sorting and ranking of bids before submission.
Note the phrase "final sorting and ranking". A sort that moves one column and not its neighbours produces exactly this, and it produces a file that looks completely normal.
Section 06
What do the five have in common?
Four failure classes, and every one of them is structural.
Silent truncation. Data stops arriving and nothing says so. Public Health England is the pure case, but the everyday version is a query with a row cap, a copy that exceeded the clipboard, an import that stopped at the first blank row, or a join that quietly dropped the rows with no match. The countermeasure is to record the row count at every hand-off and compare it with the previous one. A count that changes by an amount nobody can explain is the earliest signal you will get, and it costs one cell to maintain.
Range drift. A formula covers the wrong rows, or a paste lands one row out. Reinhart–Rogoff and TransAlta are the same class. The countermeasure is to check the extremes rather than the middle: does the range include the first and last record, and does a sort of one column carry its neighbours with it? Most totals that disagree between two people resolve to something in this family, which is the subject of why spreadsheet totals disagree.
Unvalidated type coercion. The software decides an identifier is a date, a postcode is a number, or a gene is a month. The countermeasure is to declare column types on import rather than letting them be inferred, and to check afterwards that identifiers still have the length they had in the source. A single formula comparing the character length of an identifier column against its expected width would have caught the genomics problem across two decades of papers.
No independent recomputation. Every case above was discovered by someone recomputing the result by another route, usually much later and usually from outside the organisation. The countermeasure is the only genuinely general one: work out one important figure a second way, by a different method, and reconcile the two. If they agree you have learnt something. If they disagree you have found something.
Section 07
What is not on this list
Several cases that circulate widely in this genre are missing, and deliberately. The Fidelity Magellan dividend estimate story, in which a sign error is said to have produced a distribution forecast that had to be withdrawn, is repeated in most listicles on the subject and traces back through them to a single 1995 newsgroup post. It may well be accurate. It is not documented well enough to cite here, so it is left out.
That is the general problem with this category of writing. The cases that get repeated are the ones with a memorable number attached, and the number is frequently the least verified part of the account. The five above were chosen because each has a primary or contemporaneous source that states the mechanism, not just the cost.
The European Spreadsheet Risks Interest Group has catalogued cases like these for over two decades, and its horror stories page remains the best public index of documented incidents. It is worth reading before assuming your own model is the exception.
Independent recomputation is also the mechanism Data Analysis App is built on: every figure is computed twice by two independent engines and anything the two disagree about is dropped, with the results and the misses published at /accuracy.
See it on a real project
Contractor spend rose $412,000 while headcount spend fell $448,000, leaving only a $4,000 net change.
Keep reading
Evidence
Sources
- Claburn T. (2020). Excel blamed for England COVID-19 contact-tracing data loss The Register.
- US Senate Permanent Subcommittee on Investigations (2013). JPMorgan Chase Whale Trades: A Case History of Derivatives Risks and Abuses.
- Herndon T, Ash M, Pollin R. (2013). Does High Public Debt Consistently Stifle Economic Growth? PERI.
- Ziemann M, Eren Y, El-Osta A. (2016). Gene name errors are widespread in the scientific literature Genome Biology.
- Abeysooriya M, et al. (2021). Gene name errors: Lessons not learned PLOS Computational Biology.
- The Globe and Mail (2003). Human error costs TransAlta $24 million on contract bids.