How do you calculate employee turnover from a spreadsheet?
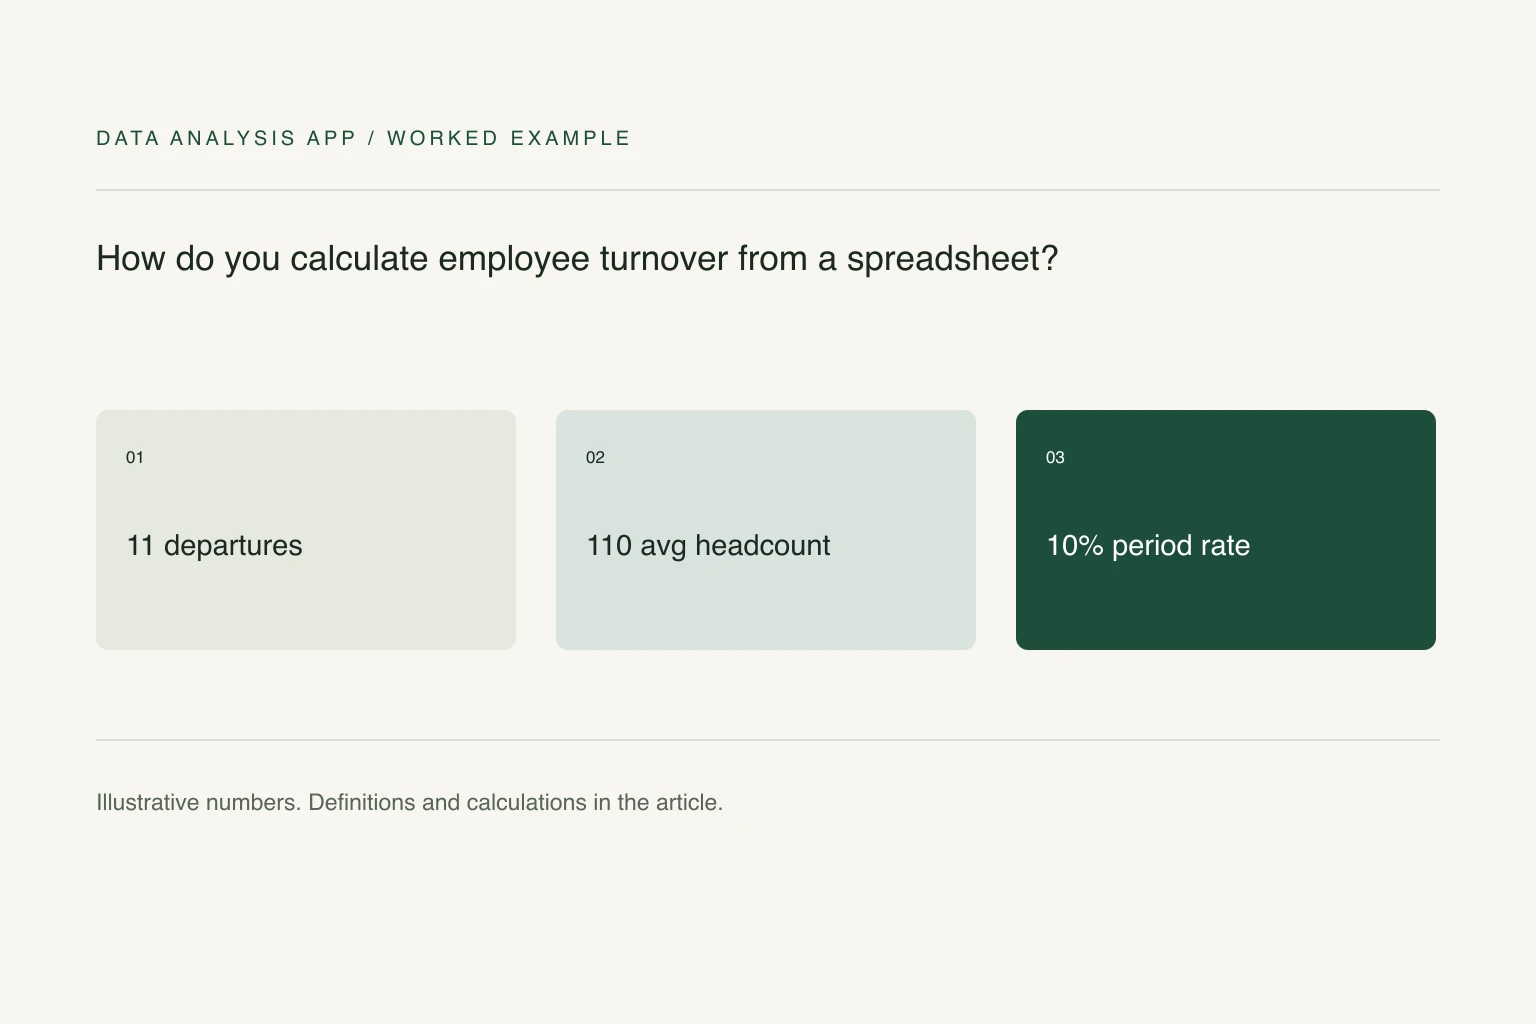
Define the workforce population and qualifying separations, then divide period departures by average headcount measured over the same period. State whether the denominator uses opening and closing snapshots or time-weighted observations. Reconcile hires, departures, transfers, and scope changes, and compare groups using their counts and denominators rather than averaging percentages.
Key numbers
- 100
- example opening headcount
- 120
- example closing headcount
- 10%
- 11 departures divided by average headcount of 110
Key takeaways
- Keep company departures separate from internal transfers.
- Explain the average-headcount method and its limitations.
- Aggregate counts and denominators instead of averaging team percentages.
A turnover percentage can change because more people left, because the workforce grew, or because the report quietly changed whom it counts. Before comparing teams or months, state which departures are included and how the average workforce is measured.
The fictional example defines a simple internal descriptive measure: separations during a period divided by average headcount during the same period. Other organizations and published statistical series may use different definitions. Do not compare the results unless the event, population, and time basis match.
Section 01
Define the population and the departure event
Choose whether the report covers employees only or also contractors, temporary staff, and other categories. Keep voluntary resignations, involuntary departures, and other separations distinguishable. An internal transfer is not an organization-wide departure, although it may be an exit from a particular team. Rehires require a documented treatment of employment spells.
Use an effective departure date consistently. A resignation notice date and the final employment date can put the same event in different months. Resolve corrections and duplicate HR records before counting. Remove names and direct identifiers from any analysis that does not need them; the useful reporting output is usually an aggregate.
Section 02
Choose a defensible average headcount
For a stable workforce with only opening and closing snapshots, a simple approximation is their average. If opening headcount is 100 and closing headcount is 120, the denominator is 110. With 11 departures, the turnover rate under this convention is 11/110 = 10% for that period.
When staffing moves materially during the period, daily or monthly snapshots provide a more representative time-weighted denominator. The opening/closing approximation can miss a large temporary increase in the middle. State the available coverage and the approximation rather than implying precision that the source cannot support.
Section 03
Reconcile the workforce movement
Check opening headcount plus hires minus departures against closing headcount, including any explicitly defined scope changes. If 100 people became 120 after 31 hires and 11 departures, the movement reconciles. Acquisitions, internal transfers, and corrections may need separate bridge rows rather than being silently included in hiring.
A team-level bridge needs both transfers in and transfers out. Counting a transfer out as a company departure and then counting the same person again in the destination team distorts the aggregate. Review the event grain: one employee record is not necessarily one employment spell or one departure.
Section 04
Compare groups and periods fairly
If one team has two departures from an average of ten people and another has nine from an average of 90, their rates are 20% and 10%. The combined rate is 11/100 = 11%, not the unweighted average of 15%. Show counts and denominators alongside rates so readers can assess the size of the groups.
Do not add monthly turnover percentages to create an annual rate. Count the year's qualifying departures and use the denominator defined for that year. A year-to-date percentage is a period result, not automatically an annualized forecast. Excel COUNTIFS can count qualifying departure records by date and category after duplicates are resolved; it does not calculate a time-weighted headcount on its own.
Section 05
Keep interpretation proportional to the evidence
A higher rate in a small team is a signal to investigate, not proof of a particular manager's performance. Role mix, contract endings, seasonality, restructures, and inconsistent source coverage can all affect the comparison. Avoid identifying individuals in small groups or using an aggregate pattern to make an unsupported judgment about a specific person.
The HR and people use case outlines broader reporting. For a free analysis, use an appropriately de-identified export and check the definitions before sharing the findings. A useful report makes its limits clear and supports a conversation; it does not automate an employment decision.
See it on a real project
Eleven people worked 37% of the overtime, and seven of them have since left. The cost is concentrated on the people walking out the door.
Keep reading
Evidence
Sources
- Microsoft (2026). COUNTIFS function.
- Data Analysis App team (2026). Related method: average or median.
- Data Analysis App team (2026). Worked project: workforce attrition.