How do you calculate customer retention by cohort?
Group customers by their first qualifying purchase period and count distinct customers who purchase again at each cohort age. Divide by the original cohort size, keeping the event definition and calendar convention fixed. Compare only fully observed ages, show cohort sizes, and leave future cells unobserved rather than treating them as zero retention.
Key numbers
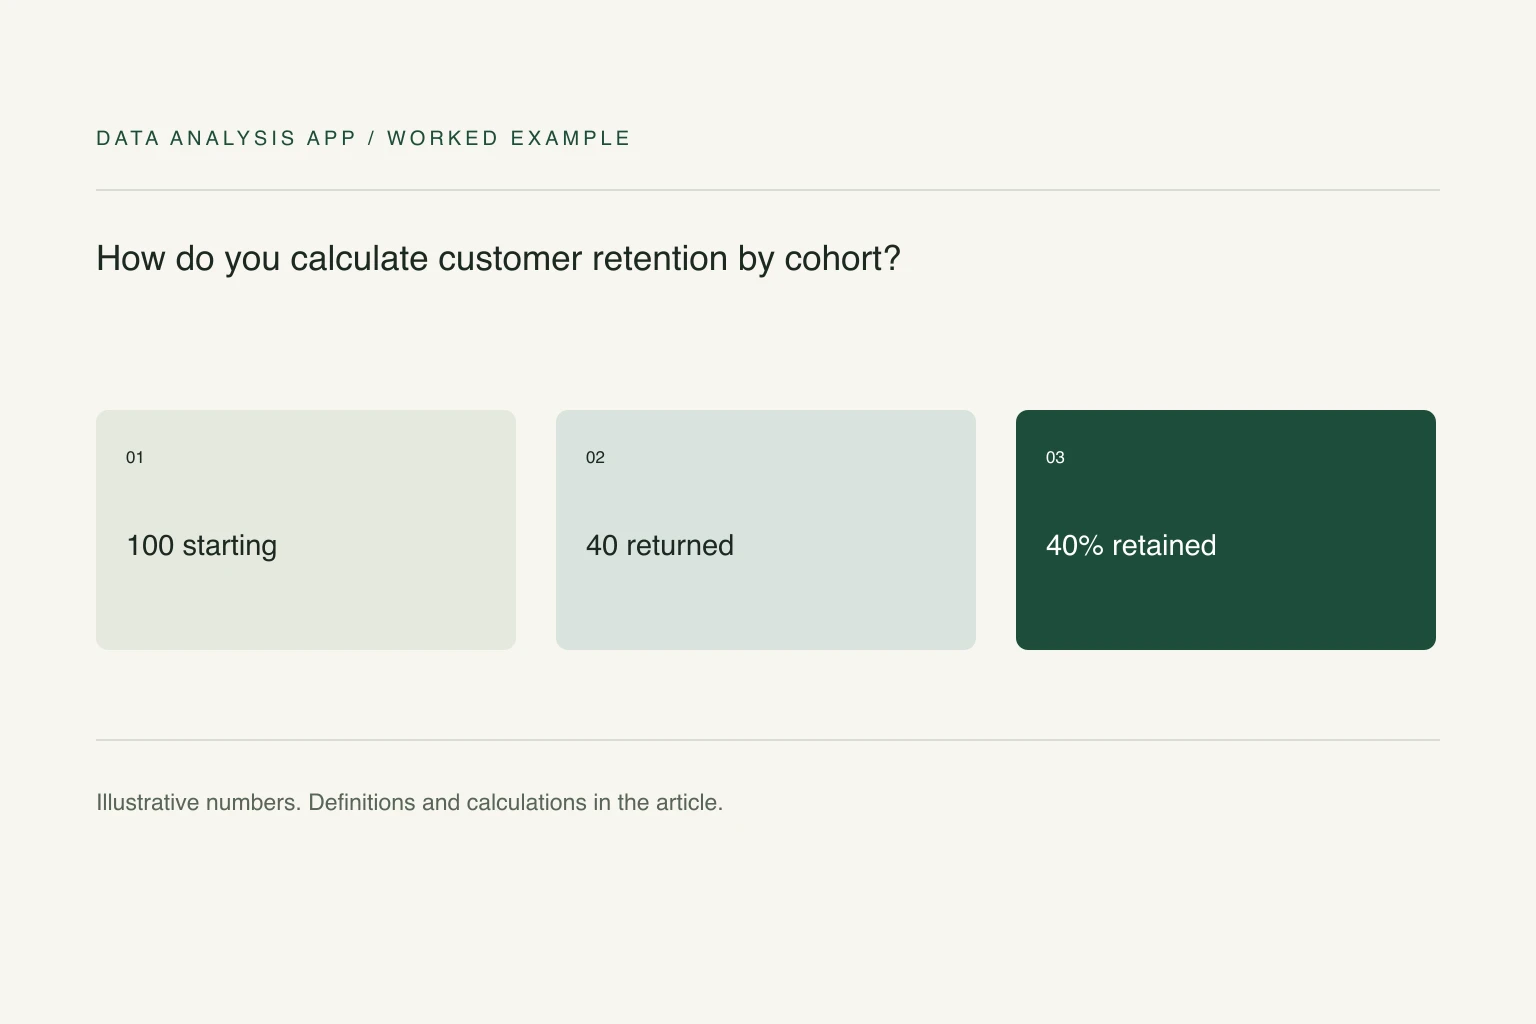
- 100
- customers in the example starting cohort
- 40
- customers returning in month one
- 40%
- exact-month retention
Key takeaways
- Count people rather than order lines.
- Compare cohorts at the same fully observed age.
- Show cohort sizes and distinguish exact-month from cumulative retention.
A rising count of repeat orders can coexist with falling retention. If acquisition doubles, more returning customers may simply reflect a much larger starting group. Cohort analysis makes the starting group explicit and compares customers after the same amount of time.
This walkthrough defines purchase retention for a fictional shop. It does not measure subscription renewal, website visits, or cumulative lifetime return. Those are useful measures with different event definitions and denominators. Write the definition before building the table.
Section 01
Define the qualifying event and starting group
Choose what counts as a purchase: for example, a completed order with positive net value after cancellations. Give each customer a stable identifier and find their first qualifying purchase in the available history. A customer who bought before your export began may look new, so document the history boundary and avoid claiming true first purchase when you cannot establish it.
Assign the customer to the month of that first purchase. Deduplicate orders before counting customers. Counting invoice lines rather than distinct people turns a three-item basket into three retained customers. Keep anonymous transactions separate if you cannot link them reliably across months.
Section 02
Give each cohort the same clock
For each purchase, calculate the number of calendar months since the customer's starting month. Month 0 is the starting month; month 1 is the next calendar month. Under this definition, buying again three days later in a new month can qualify for month 1. A rolling 30-day definition would behave differently, so do not mix them.
Create one row per customer and cohort-age month in which they made a qualifying purchase. Distinct customer counts can then populate a pivot table. A helper table at that grain also lets COUNTIFS count customers without accidentally counting repeat purchases several times.
Section 03
Work the denominator explicitly
Imagine 100 customers made their first qualifying purchase in January. Forty bought in February and 25 bought in March. January's month-1 retention is 40/100 = 40%, and month-2 retention is 25/100 = 25%. Customers absent in February may still appear in March: this is exact-month retention, not an unbroken retention streak.
If February acquired 200 customers and 60 bought in March, its month-1 retention is 30%. It produced more returning customers than January did at month 1, but retained a smaller share of its starting cohort. The difference is ten percentage points. This is why both counts and rates belong in the table.
Section 04
Leave future cells empty
A March cohort observed through April has a month-1 value but no month-2 result yet. Mark that later cell Not observed. Writing zero would turn customers who have not had a chance to return into apparent churn. Compare cohorts only at ages that every group in the comparison has reached.
Show cohort sizes beside percentages. A 50% result from two customers is not as stable as a 50% result from 2,000. If you combine cohorts, sum retained customers and starting customers first. An unweighted average of cohort percentages gives a tiny group the same influence as a large one.
Section 05
Use differences as questions to investigate
A weak cohort may reflect a promotion, product change, tracking break, or a different customer mix. The table identifies when the pattern changed; it does not establish which cause is responsible. Compare relevant segments only after confirming enough history and stable customer identifiers.
The dashboard guide explains how to expose these definitions beside a chart. You can start a free analysis with your order export and review the data quality before buying outputs. Keep the qualifying event, history coverage, and cohort-age convention attached to the result so another person can reproduce it.
See it on a real project
Product A produced 68% of total growth while repeat purchasing fell from 31% to 24%.
Keep reading
Evidence
Sources
- Microsoft (2026). COUNTIFS function.
- Data Analysis App team (2026). Related method: turn a csv into a dashboard.
- Data Analysis App team (2026). Worked project: shopify profitability.