How do you analyze budget vs actual variance?
Compare budget and actual amounts using the same categories, period, currency, and accounting basis. Calculate actual minus budget, then divide by budget only when the baseline is meaningful and nonzero. Separate timing differences from recurring changes, reconcile the total, and assign an owner and action to each material variance.
Key numbers
- 100 hours
- planned contractor volume
- 120 hours
- actual contractor volume
- $1,400
- cost variance to explain
Key takeaways
- Reconcile category totals before interpreting a difference.
- Show dollars and percentages; a zero budget has no meaningful percentage variance.
- Separate rate, volume, timing, and recurring changes before assigning an action.
A budget report becomes useful when it distinguishes a real change in performance from a timing difference, a different definition, or a missing transaction. A red percentage alone does none of that. Start with an explicit question: which differences need a decision this month, and which will resolve without one?
The following example uses invented figures for a small service business. The same checks work for a department budget or a personal spending plan. Keep the original exports unchanged so that every adjustment can be traced back to its source.
Section 01
Make the two sides comparable
Use one row per category and period, with separate columns for budget, actual, and the explanation. Both sides must use the same currency, date boundary, and accounting basis. Comparing cash paid in October with expenses incurred in October makes an unpaid invoice look like a saving.
Map category names before calculating differences. A budget called Software and an actual category called Subscriptions need a documented mapping, not a fuzzy match that happens to find similar words. Preserve unmapped transactions in a visible exception bucket. If the mapped actual total differs from the source export, stop and reconcile the import before interpreting the variance. The month-end checklist covers useful source checks.
In Excel, SUMIFS can aggregate the actual amount for a category and period using multiple criteria. Reconcile that grouped result against the original export; a working formula does not prove that every row has a valid category.
Section 02
Calculate amount and percentage separately
Define the arithmetic consistently: variance amount equals actual minus budget. If software was budgeted at $800 and cost $1,000, the variance is $200. Divide that amount by the $800 budget to get 25%. For a cost, this is unfavorable; for revenue, an equally positive variance would usually be favorable. A plus sign does not determine the business meaning.
When the budget is zero, the percentage is undefined. Display the amount and label the percentage Not applicable. Do not replace the zero with one or suppress the row. A $400 unplanned expense matters even though it cannot be expressed as a meaningful percentage of zero. For negative budgets, explain the convention explicitly or omit percentage variance rather than presenting a misleading signed ratio.
Section 03
Split a large gap into its causes
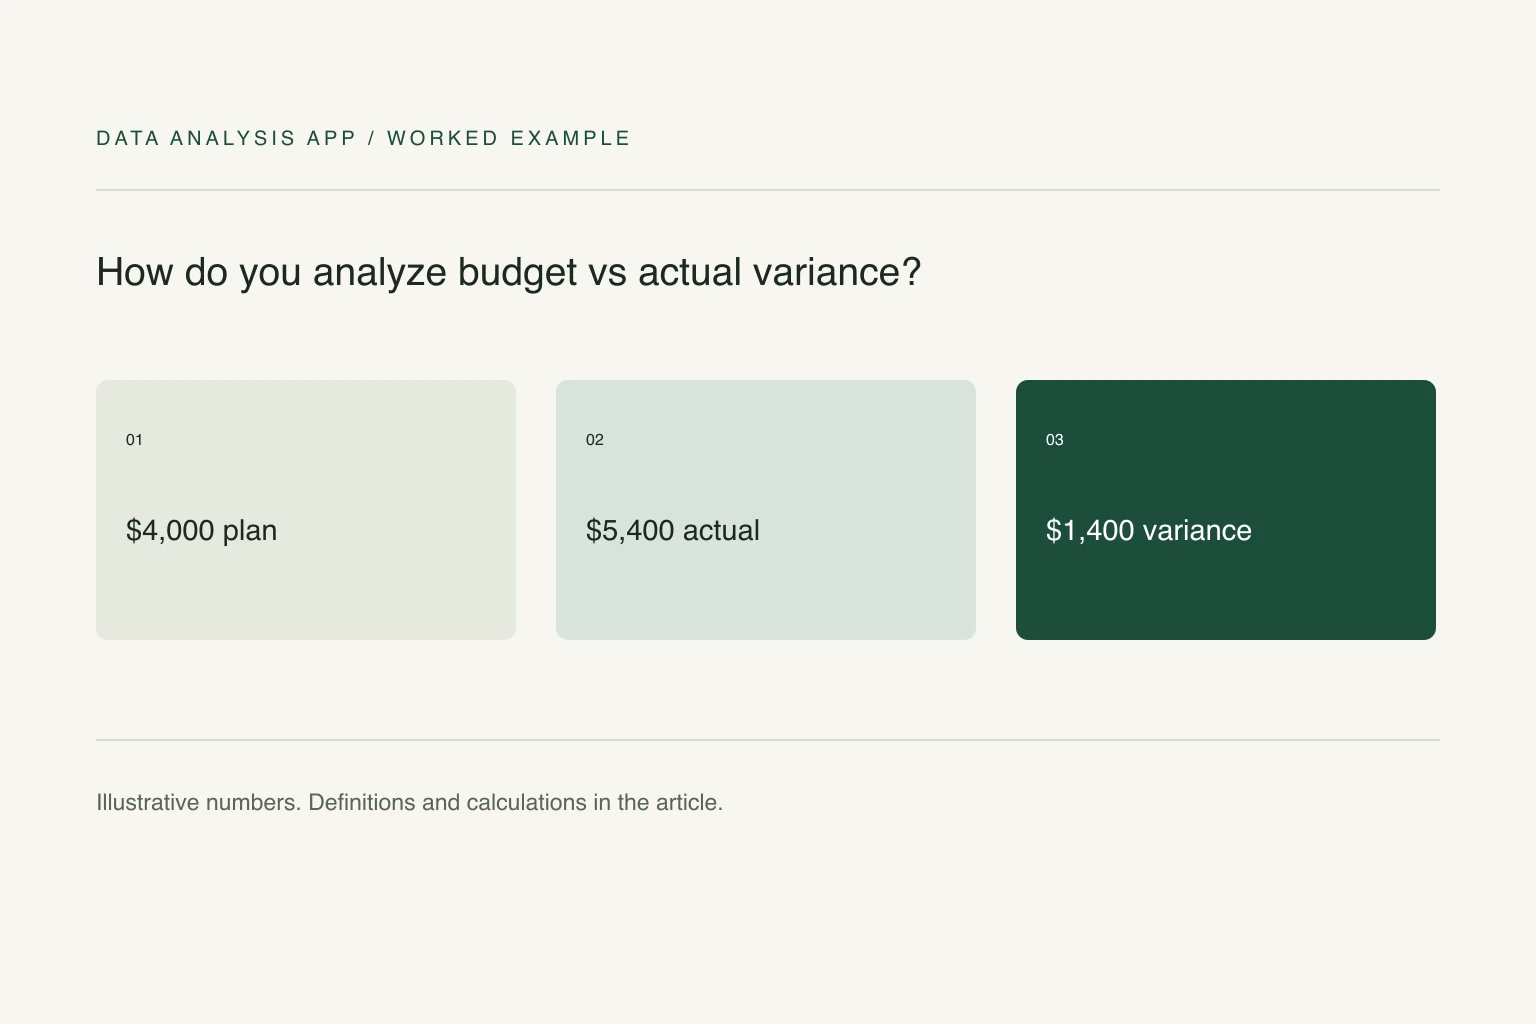
Suppose a team planned 100 contractor hours at $40 per hour, but bought 120 hours at $45. Budget cost was $4,000 and actual cost was $5,400. The $1,400 difference can be explained by $800 for the extra 20 hours at the planned rate, plus $600 for the $5 rate increase across the actual 120 hours. These two parts add exactly to the reported variance.
That decomposition uses the planned rate for volume and the actual volume for rate. Other valid conventions allocate the interaction differently. Choose one, label it, and keep it stable. The decision is now concrete: was the extra work necessary, and was the higher rate approved? A narrative saying only that costs rose 35% hides both questions.
Section 04
Decide what deserves attention
Review dollars and percentages together. A 100% increase from $10 to $20 may need less attention than a 4% increase on a $100,000 contract. Set review thresholds before seeing the results, and retain smaller exceptions where they represent a repeated control failure. Thresholds are a management policy, not a universal statistical rule.
Assign an owner, an explanation, an action, and a review date to each material difference. Distinguish recurring changes from one-off invoices and timing shifts. Never add percentages across categories: sum the budget and actual amounts first, then calculate the total variance. Check that category variances reconcile to that total.
Section 05
Turn the report into a repeatable review
Keep the category mapping and period definition beside the workbook. Next month, rerun the same checks before changing the explanations. A changed category map can manufacture apparent improvement without a single change in the underlying business.
The quarterly board-pack example shows how a checked result can become a decision document. To inspect your own export, start a project. Free findings let you assess the result before deciding whether to buy downloadable outputs. The report can identify and explain a difference; the person responsible still decides whether it was justified.
See it on a real project
Contractor spend rose $412,000 while headcount spend fell $448,000, leaving only a $4,000 net change.
Keep reading
Evidence
Sources
- Microsoft (2026). Sum values based on multiple conditions Microsoft Support.
- Data Analysis App team (2026). Related method: month end close spreadsheet checks.
- Data Analysis App team (2026). Quarterly board-pack worked example.