What is the difference between a blank and a zero in data analysis?
A zero is an observed value; a blank usually means a value is missing, unavailable, or not applicable. Replacing blanks with zero changes averages, rates, and charts. Establish why each value is absent, choose the denominator deliberately, and report coverage alongside the result rather than treating missing observations as measured inactivity.
Key numbers
- 3 of 4
- example observed values
- 20
- average of observed 0, 20, 40
- 15
- average after filling one blank with 0
Key takeaways
- Record a missingness reason before choosing a treatment.
- Show coverage beside every incomplete metric.
- A chart gap and a measured zero communicate different evidence.
A dashboard shows that one branch had no sales yesterday. Did the branch trade and sell nothing, close for a holiday, fail to upload its file, or open after the export was generated? A blank cell cannot answer that question by itself.
Treat missingness as part of the data model. A result with incomplete coverage can still be useful, but the reader needs to know which observations support it and which remain unknown.
Download the synthetic missing-value example. The empty field is deliberately missing, not a measured zero.
Section 01
Define the meaning of absence
Separate a measured zero from missing, not applicable, not yet available, and deliberately suppressed values. These states have different implications. A store closed for refurbishment may belong in a capacity analysis but not in the denominator for average sales per trading store.
Keep the original field and add a status column where the source supports it. Do not infer the reason solely from an empty cell. Ask the source owner whether a blank means no activity or no submission, and document the answer before building a recurring report.
Section 02
Compare the arithmetic before filling anything
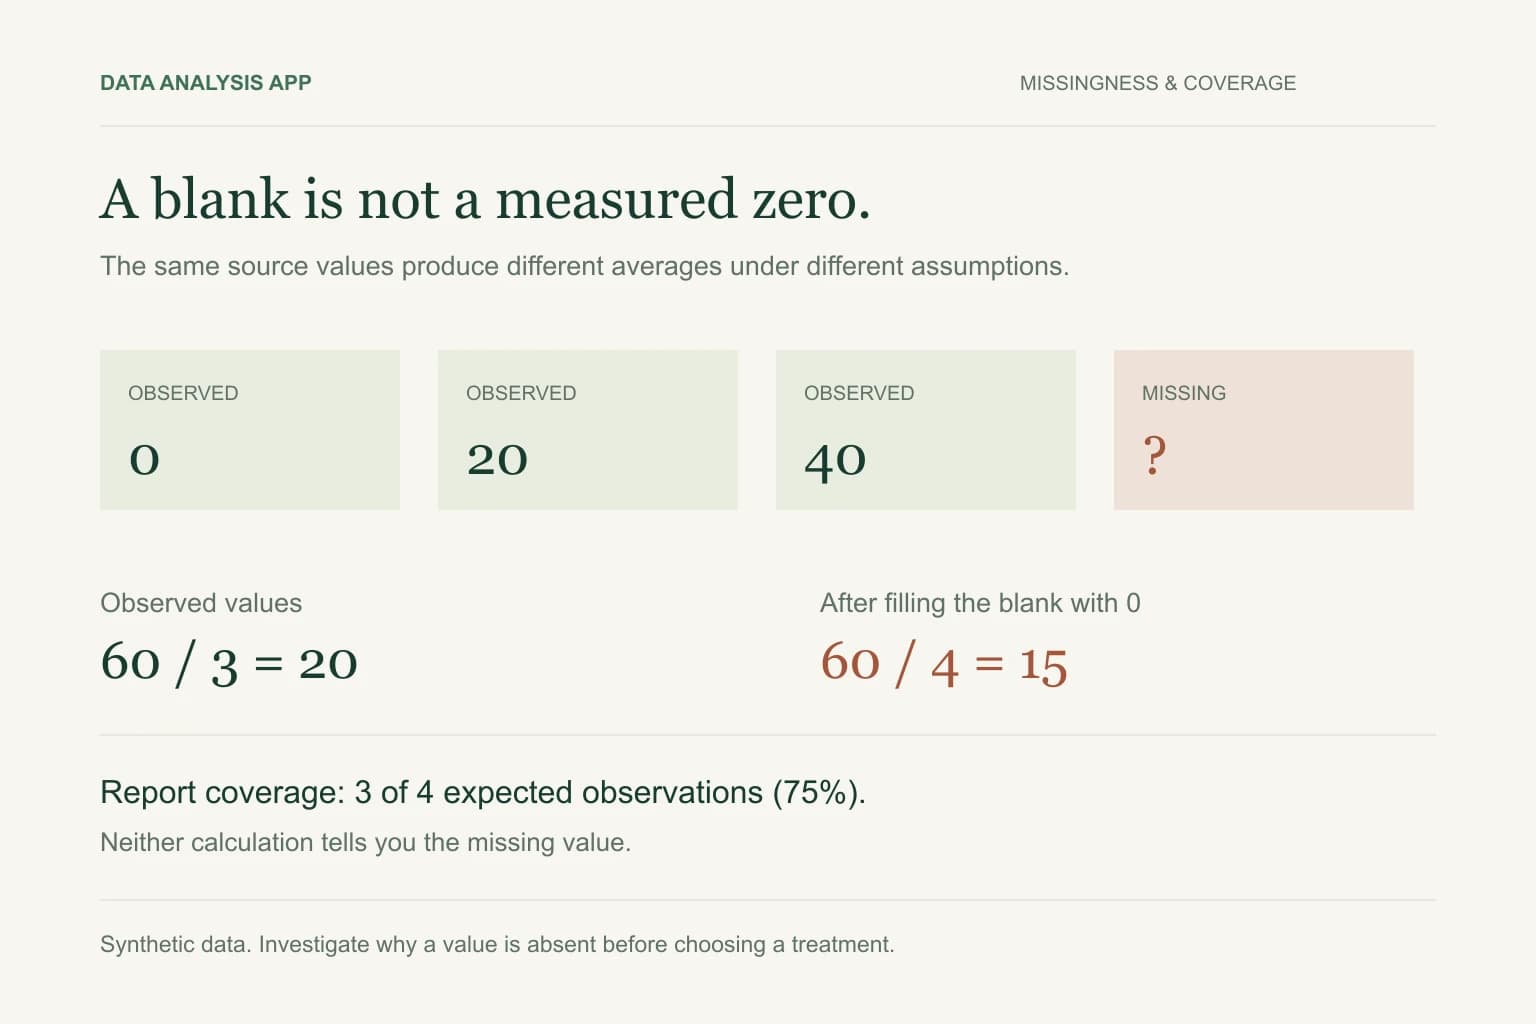
Consider four expected observations: 0, 20, 40, and a blank. The sum of measured values is 60. The average among three observed values is 20. Replacing the blank with zero creates four numeric values and lowers the average to 15. Neither figure describes the missing observation's true value.
Excel's AVERAGE ignores empty cells and text in referenced ranges while including numeric zeros. That behavior is useful to understand, but it does not select the correct business definition for you. Check formulas returning an empty string, text markers such as N/A, and actual error values separately from genuinely empty cells.
Section 03
Show coverage alongside the metric
Report the average of 20 with coverage of three out of four expected observations, or 75%, when available-case analysis is appropriate. Name the missing branch or period in an exception list. If a business decision depends heavily on the absent observation, hold the conclusion until the source is recovered.
The expected population must also be justified. Four records in a file do not prove that four records were expected. Use a roster, calendar, reporting schedule, or other independent source to distinguish missing rows from missing cells. A dataset with no blanks can still omit an entire location.
Section 04
Keep rates and averages consistent
For a service-rate calculation, a missing numerator with a known denominator is not automatically zero successes. If the numerator was never submitted, the rate is unavailable for that group. Exclude incomplete pairs under an explicit rule and disclose the excluded denominator rather than summing every denominator with only the available numerators.
The weighted-percentage method shows how a mismatched base can distort an overall result. A total computed from complete groups should be labeled with that scope. Do not compare it with an earlier period that covers a different set of groups without discussing the coverage change.
Section 05
Use charts that reveal the gap
A line falling to zero claims that activity was measured at zero. A gap indicates that no comparable observation is available. Choose the representation that matches the evidence, and distinguish an incomplete current period from a completed period with low activity.
- Keep measured zeros in the data and label them when material.
- Show missing periods visibly instead of silently connecting distant observations.
- Explain suppressed small groups without revealing their individual values.
- Place coverage and the reporting cut-off next to the chart.
Hiding zero values through spreadsheet display settings does not turn them into blanks. Inspect the underlying cells when a chart or average behaves unexpectedly. A visually empty workbook is not a reliable description of its stored values.
Section 06
If you impute, keep the assumptions reviewable
Imputation means replacing a missing value using an assumption or model. Forward filling, historical averages, and zero filling are different assumptions with different effects. Preserve an imputation flag and compare the conclusion with an analysis using only observed data. Do not describe imputed observations as measured facts.
Before using Data Analysis App, preserve missingness markers and add a short explanation of the expected population. Review the findings for coverage limitations. A professional output should make uncertainty easier to see, and it should never convert absent evidence into a confident zero.
See it on a real project
Contractor spend rose $412,000 while headcount spend fell $448,000, leaving only a $4,000 net change.
Keep reading
Evidence
Sources
- Microsoft (2026). Microsoft: AVERAGE behavior.
- Microsoft (2026). Microsoft: displaying and hiding zeros.
- Data Analysis App team (2026). Related method: coverage and dashboard checks.