How do you analyze a GA4 CSV export accurately?
Record the property, date range, time zone, filters, dimensions, and metric definitions before analyzing a GA4 CSV. Separate summary totals from detail rows, avoid summing overlapping distinct-user counts, and calculate rates from compatible base metrics. Treat a report export as an aggregate view, not as a raw event log.
Key numbers
- 100,000
- documented report-export row ceiling
- 1 person
- can appear in several daily groups
- 1 scope
- required for a valid comparison
Key takeaways
- Keep summary rows separate from detail rows.
- Distinct users cannot generally be added across days or overlapping groups.
- Check scope and coverage before interpreting a channel comparison.
A CSV exported from GA4 looks like a simple table, but its numbers retain the rules of the original report. Distinct users, attributed conversions, sessions, and engagement rates are not interchangeable counts that can be summed in every direction.
Start by preserving the report context. A chart built from a clean-looking export can still misstate the result if totals are included twice or the denominator changes between rows.
Section 01
Save the scope with the file
Record the property, report name, date range, property time zone, filters, comparisons, dimensions, and metrics. Include the export time and whether the last reporting day is complete. Keep this note beside the original CSV so a colleague can recreate the view.
A report export is an aggregated result, not the raw sequence of every user event. A session-level channel dimension and a user-level acquisition dimension answer different questions. Read the metric and dimension definitions for the exact fields before joining two exports with similar-looking names.
Section 02
Identify headers, detail rows, and totals
Inspect the first and last rows before loading the data into a chart. Exports can include explanatory content or summaries that need to remain separate from the detail table. Do not assume every numeric row is another category to be summed.
Suppose a synthetic export has channel rows totaling 100 sessions plus a summary row showing 100 sessions. Appending every row into one amount column produces 200. Preserve the summary as a control value and exclude it from the detail calculation under an explicit parsing rule.
Section 03
Do not add daily distinct users
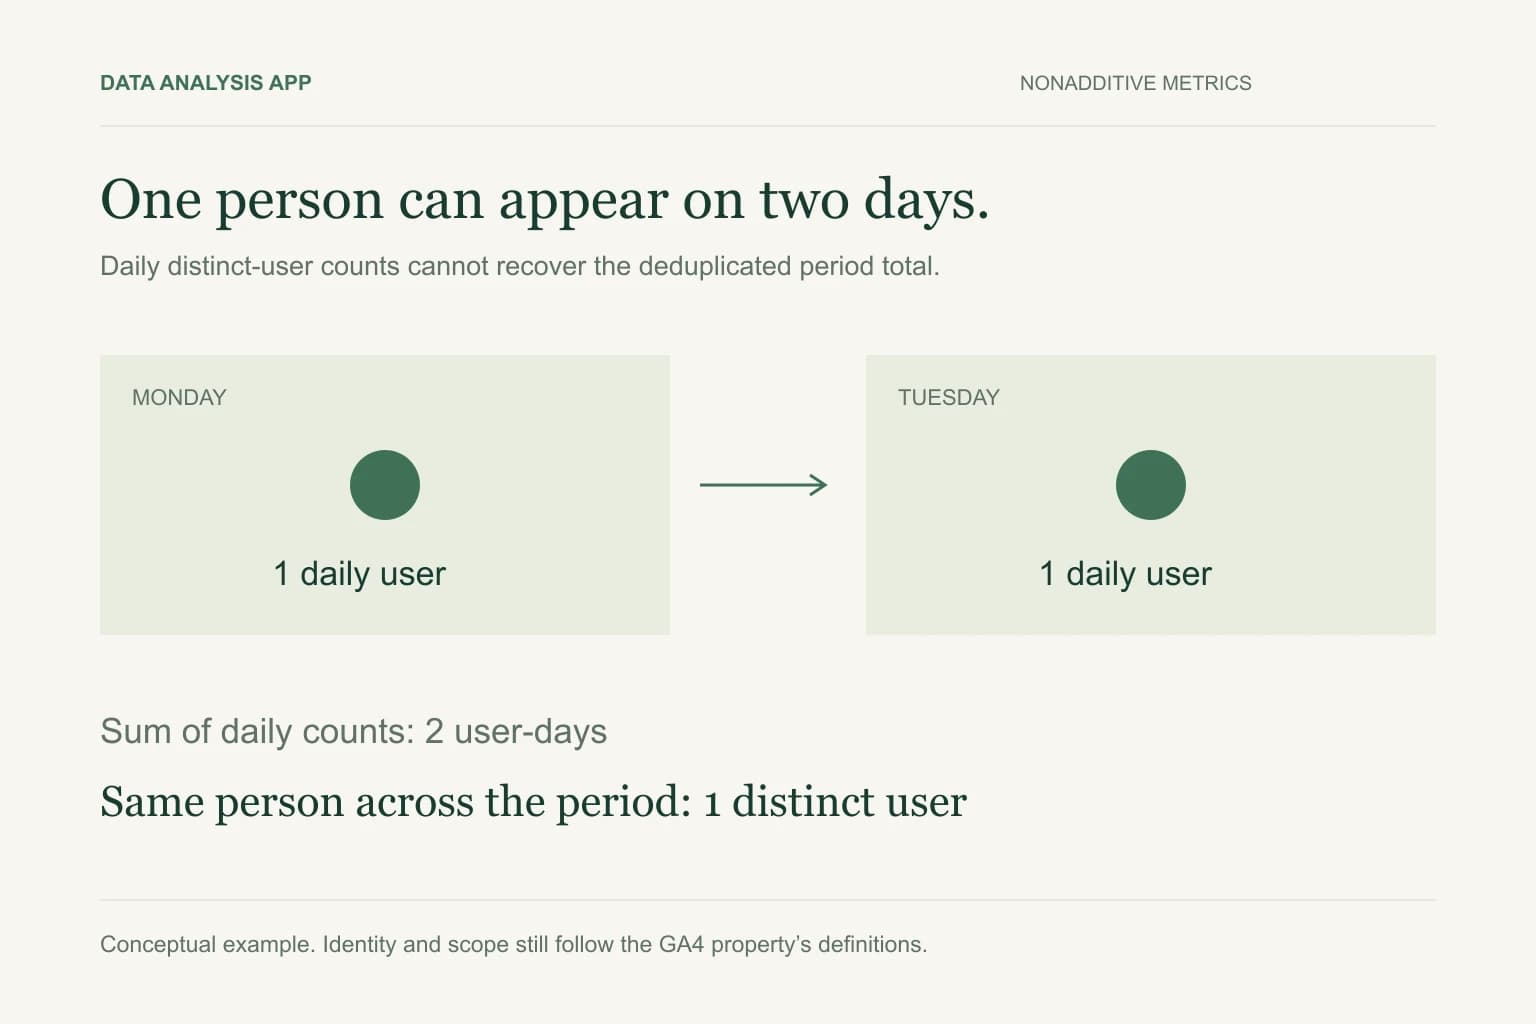
One person visiting on Monday and Tuesday can appear in both daily user counts while counting once in the period-level distinct-user result, subject to the property's reporting identity and measurement. Summing the two daily counts describes user-days, not deduplicated people across the period.
Use a period-level metric from GA4 when the question concerns distinct users for that period. A CSV of daily aggregates generally cannot reconstruct the deduplicated total because it does not contain the identities needed for that operation. State the limitation instead of presenting the sum as a recovered user count.
Section 04
Recompute rates from compatible bases
For an engagement-rate calculation, use engaged sessions divided by sessions from the same scope and compatible groups. The average of displayed channel percentages gives each channel equal weight, which usually differs from the share across all sessions. The weighted-percentage guide explains the denominator problem.
Check whether groups are mutually exclusive before summing their base measures. Do not substitute users for sessions or event counts for sessions merely because the resulting percentage looks plausible. Keep unavailable or zero denominators visible rather than converting every failed calculation to zero.
Section 05
Check coverage and reporting limitations
Google documents that report CSV and Sheets exports include up to 100,000 rows. A large export therefore needs a coverage check; the presence of a downloaded file does not establish completeness. Explorations and API exports have their own behavior, so use the instructions for the actual export route.
Also record any quality warnings, thresholding, sampling, reporting-identity considerations, or grouped categories shown by the source report. Do not claim those warnings apply to every dataset, but do not erase them when they do apply. Compare the export's control totals with the same report view after accounting for its row structure.
Section 06
Compare performance without confusing acquisition and revenue
A channel with many visits is not necessarily producing more purchases. Define the purchase event, attribution window, and revenue source before making a business claim. Internal QA, preview deployments, bot traffic, and referral artifacts can also distort a small site's apparent engagement.
Keep Search Console clicks, GA4 sessions, and payment-provider transactions as separate measures. Their definitions, time zones, consent effects, and reporting windows differ. Joining them by date alone does not prove that a particular search query led to a particular payment.
Section 07
Turn a checked export into a useful report
Choose one question, such as which complete weeks had the largest change in engaged sessions. Retain the base measures, coverage note, and reporting cut-off beside the chart. Use the dashboard checking method before circulating the result.
To inspect the file in Data Analysis App, start a project with an authorized, minimized CSV. Review the detected fields and limitations in the free findings first. This article describes manual report exports, not a live GA4 connection or a guarantee that aggregated data can recover missing user-level detail.
See it on a real project
Three platforms claimed 8,412 conversions but described 4,318 orders. 2,580 of the claims were the same order counted again.
Keep reading
Evidence
Sources
- Google (2026). Google Analytics: share and export reports.
- Google (2026). Google Analytics: dimension and metric definitions.
- Data Analysis App team (2026). Related method: percentage denominators.