What is the difference between survey response rate and completion rate?
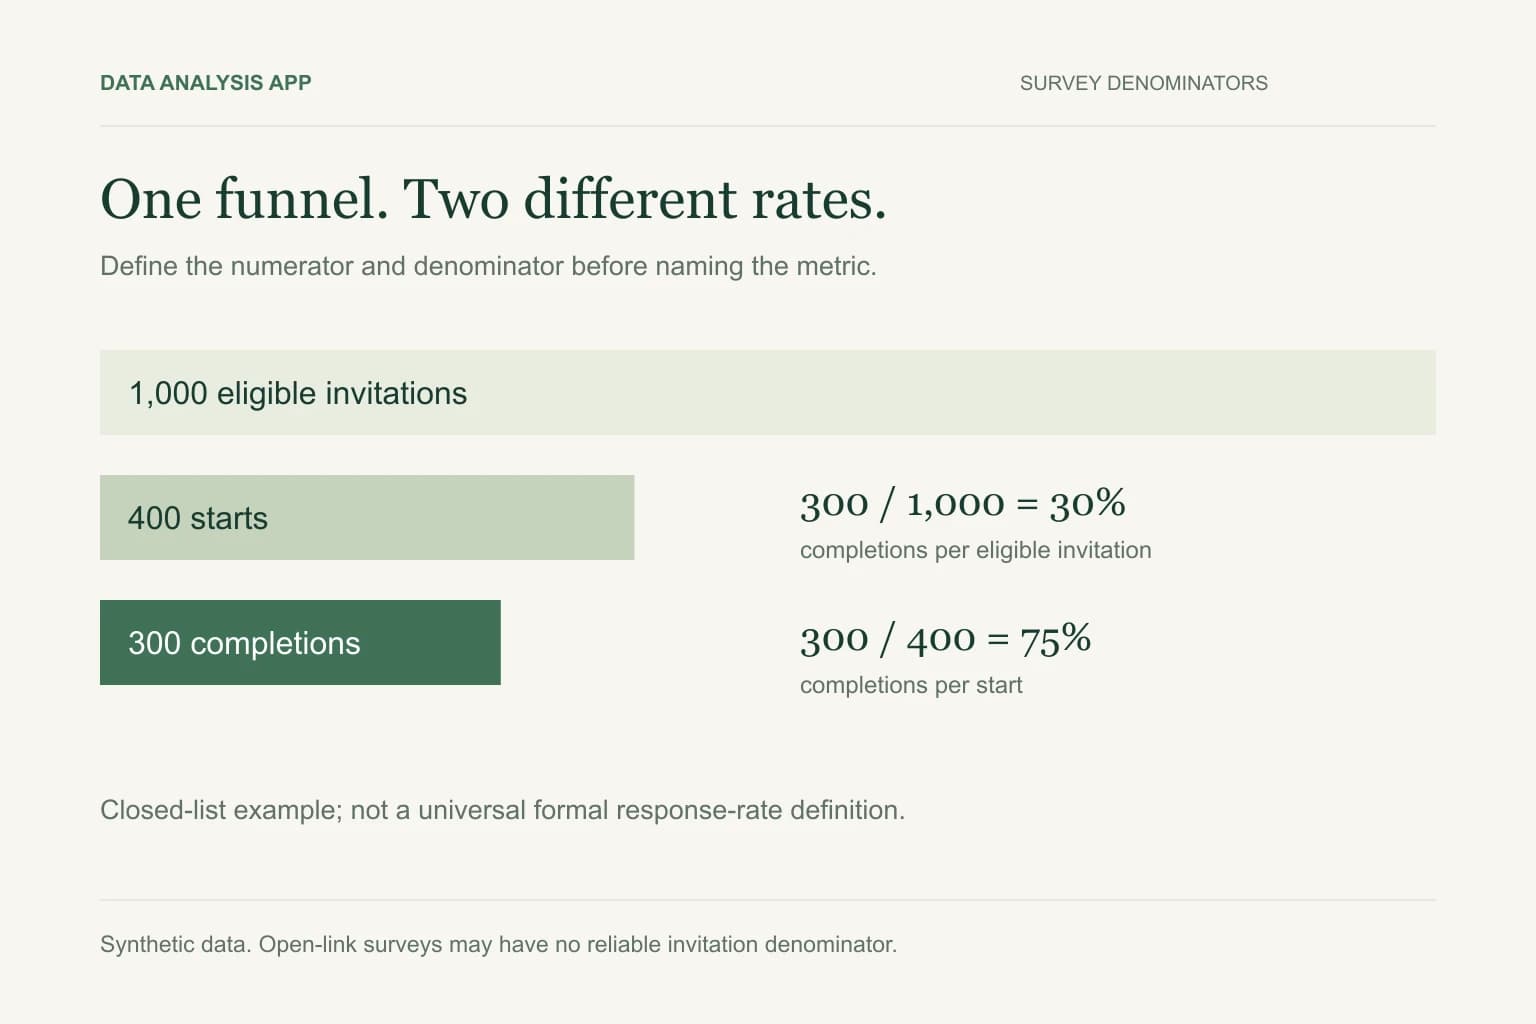
A response rate relates participation to an eligible invited population under a stated definition; a completion rate commonly relates completed surveys to starts. They use different denominators. Record invitations, eligibility, starts, partials, and completions separately, and avoid claiming a population response rate when an open link provides no reliable invitation base.
Key numbers
- 1,000
- eligible invitations in the example
- 30%
- completed surveys per invitation
- 75%
- completed surveys per start
Key takeaways
- Name the numerator and denominator beside each rate.
- Open links usually lack a reliable invitation base.
- Completion and response rates do not establish representativeness.
A survey dashboard says 75% completed. A project manager reads that as three quarters of customers having responded. In reality, the figure may describe only the people who opened the questionnaire and began answering.
Make the denominator visible before interpreting the number. Participation, completion, and question-level coverage describe different stages, and each can point to a different operational problem.
Download the synthetic funnel counts. These are overlapping stages of one funnel and must not be added as separate people.
Section 01
Keep a disposition record
Track the number invited, known ineligible cases, undeliverable invitations, starts, partial responses, completed responses, and any unknown eligibility cases available from the survey system. Define what counts as a start and a completion. A respondent who submits the final page may still have skipped important questions.
Retain respondent or invitation keys only where lawful and appropriate. Deduplicate under a written rule so reminders do not create extra invitations or responses. For anonymous surveys, explain any limits on linking invitations to submissions rather than claiming certainty the data cannot provide.
Section 02
Work through the two denominators
Suppose one thousand eligible people are invited, four hundred start, and three hundred complete. Completed surveys divided by eligible invitations is 30%. Completed surveys divided by starts is 75%. Starts divided by invitations is 40%. These are simple operational measures for this invented closed-list example.
Label them with their definitions. Calling every measure Response rate makes the funnel impossible to interpret. The 75% result concerns retention through the questionnaire; it does not establish that 75% of the invited population participated.
Section 03
Do not label a simple ratio as a formal AAPOR rate
AAPOR provides standardized definitions and a calculator that account for survey dispositions, including eligibility and partial interviews. Select the applicable definition for the study design and report it. A completed-over-invited ratio is not automatically the correct standardized response rate for every sample.
Unknown eligibility, household selection, and partial interviews can change the relevant calculation. Preserve the disposition data so a researcher can select and reproduce the appropriate definition. If those records are missing, describe the available operational ratio and its limitation rather than inventing the missing cases.
Section 04
Treat open-link surveys differently
A public link posted on a website has no reliable count of all eligible people who saw it. Page views are not necessarily invitations: a person may view the page repeatedly, and some visitors may be ineligible. A completion-per-start measure can still describe the observed questionnaire funnel if starts are measured consistently.
State that the invitation base is unknown. Avoid using website traffic as a substitute for a sampled eligible population. An open-link survey can provide useful feedback without supporting a conventional population response rate or representative opinion estimate.
Section 05
Inspect item-level missingness
Of three hundred completed submissions, perhaps only 240 answer a satisfaction question. Its answer base is 240, not 300 or 1,000. Report the sixty missing answers and any routing rule. A question shown only to customers who contacted support has a different eligible base from a question shown to everyone.
The Likert analysis method shows why skipped answers should not become Neutral. Keep question-level valid counts available in every subgroup comparison so a higher score is not mistaken for stronger evidence when coverage has fallen.
Section 06
Diagnose the point of loss
Low starts among delivered invitations suggest checking audience fit, invitation clarity, timing, and access problems. Many starts with few completions suggest reviewing length, confusing questions, mobile usability, and sensitive required fields. Those are hypotheses to investigate, not conclusions that the funnel alone proves.
Compare cohorts using equal follow-up windows. A survey launched yesterday has had less opportunity to collect responses than one closed last month. Keep collection dates and reminder timing beside the rates, and avoid treating a still-open cohort as final.
Section 07
Report what the design can support
A high completion rate does not eliminate nonresponse bias, and a low response rate alone does not measure its size. Compare respondent coverage with known population characteristics when appropriate and disclose recruitment and weighting methods. Do not present narrow confidence intervals that the sampling design cannot justify.
For Data Analysis App, prepare a response export plus the disposition definitions you can substantiate. Start a project, inspect the valid bases and missingness, and use the findings to choose the next check. Keep participant identities and sensitive comments out of shared outputs unless their inclusion is necessary and authorized.
See it on a real project
The apparent 0.42-point gap fell to 0.07 once partial responses were included.
Keep reading
Evidence
Sources
- AAPOR (2026). AAPOR: response-rate definitions and calculator.
- AAPOR (2026). AAPOR: survey disclosure.
- Data Analysis App team (2026). Related method: preparing survey exports.