Why do multiple-response survey percentages exceed 100 percent?
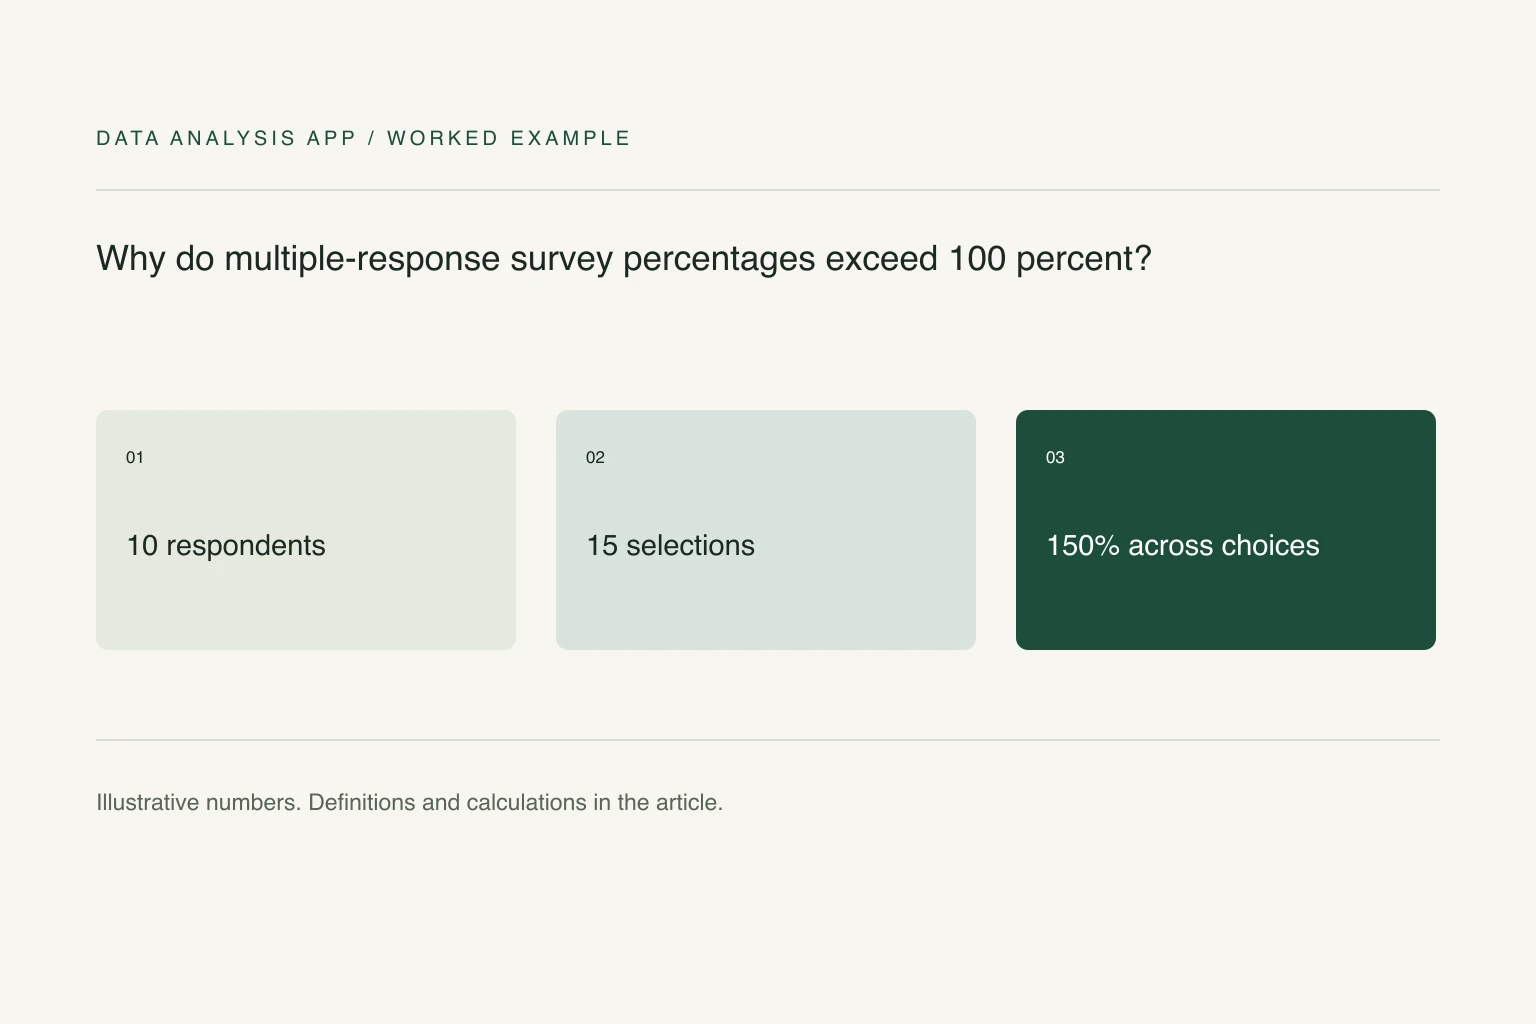
A respondent can select more than one option, so percentages using respondents as the denominator can sum above 100 percent. Percentages of selections use a different base and sum to about 100 percent. Label the denominator, show valid respondent counts, and account for skipped questions, routing rules, and choices that some people never saw.
Key numbers
- 10
- example respondents answering
- 15
- total selections made
- 150%
- sum of respondent-based option percentages
Key takeaways
- Count distinct respondent-option pairs, not arbitrary export rows.
- Label percentages of people separately from percentages of selections.
- Keep missing, skipped, and exclusive answers distinguishable.
A select-all-that-apply question counts people and selections differently. If one respondent chooses three options, that is one person but three selections. Both are legitimate units of analysis; a percentage becomes misleading when the chart hides which denominator it uses.
The fictional example below is small enough to check by hand. It focuses on descriptive reporting, not statistical significance, population estimates, or a claim that the people who answered represent everyone you invited.
Section 01
Establish who could answer
Record the number invited, the number who reached the question, and the number who provided a valid answer. Routing rules can mean that only part of the sample saw a question. An unanswered question is not automatically a None response, and a hidden option is not an option that every respondent rejected.
Keep a stable respondent ID. A long export may have one row per selected option, while a wide export may have a separate column for each choice. Inspect that shape before counting rows. Duplicate records and repeated submissions need an explicit rule; deleting every repeated answer combination can remove different people who happened to choose the same options.
Section 02
Count respondents and selections separately
Suppose ten people answered a question. Six selected Email, five selected Phone, and four selected Chat. There are 15 selections from ten people. The percentage of respondents choosing each option is 60%, 50%, and 40%. These sum to 150% because some respondents chose more than one option.
If the question asks how the selections are distributed, divide each count by 15 instead. The resulting shares are 40%, about 33.3%, and about 26.7%. Those sum to approximately 100%, subject to rounding. The second chart does not say that only 40% of people wanted Email. It says Email accounted for 40% of all selections.
Section 03
Choose a chart that preserves the meaning
For percentage of respondents, use separate bars with an explicit base of ten valid respondents. Add a note that multiple answers were allowed and the percentages need not total 100%. A pie chart suggests a single partition of a whole and is a poor fit for overlapping groups.
For percentage of selections, a composition chart may be appropriate if the question genuinely concerns the distribution of mentions. Label it as selections, not respondents. Keep the raw choice counts accessible so readers can distinguish a change in sample size from a change in preferences.
Section 04
Treat missing and exclusive answers carefully
If None of the above is meant to be exclusive, check whether any response includes it alongside another option. Report that inconsistency before choosing a repair. A blank cell may mean no answer, a skipped question, or an unselected choice depending on the export format. Confirm the coding rather than replacing every blank with zero.
In a wide one-row-per-person table, COUNTIFS can count people selecting a particular coded option. In a long table, deduplicate respondent-option pairs first. Qualtrics' crosstab documentation distinguishes bases involving those answering and those eligible to answer; routing and choice visibility can alter the appropriate denominator.
Section 05
Compare subgroups using their own bases
Suppose four of five returning customers select Email and two of five new customers select it. Report 80% of returning respondents and 40% of new respondents, with both small bases shown. Dividing each count by all ten respondents would describe the whole sample's composition instead of each subgroup's preference.
The survey analysis guide covers the wider workflow. You can upload an export to inspect free findings, but carry the question wording, response coding, and routing rules into your review. A tool cannot recover a missing denominator from a chart title alone.
See it on a real project
The apparent 0.42-point gap fell to 0.07 once partial responses were included.
Keep reading
Evidence
Sources
- Qualtrics (2026). Crosstabs and percentage bases.
- Data Analysis App team (2026). Related method: how to analyse survey results.
- Data Analysis App team (2026). Worked project: survey results.