How do you create an executive KPI report from a spreadsheet?
Choose the decision first, then define each metric, source, period, filter, unit, and owner. Reconcile headline changes to their components, compare results with both the prior period and plan, and label estimates and missing coverage. Finish with a specific action and review date, while keeping source calculations available for scrutiny.
Key numbers
- $100,000
- example starting revenue
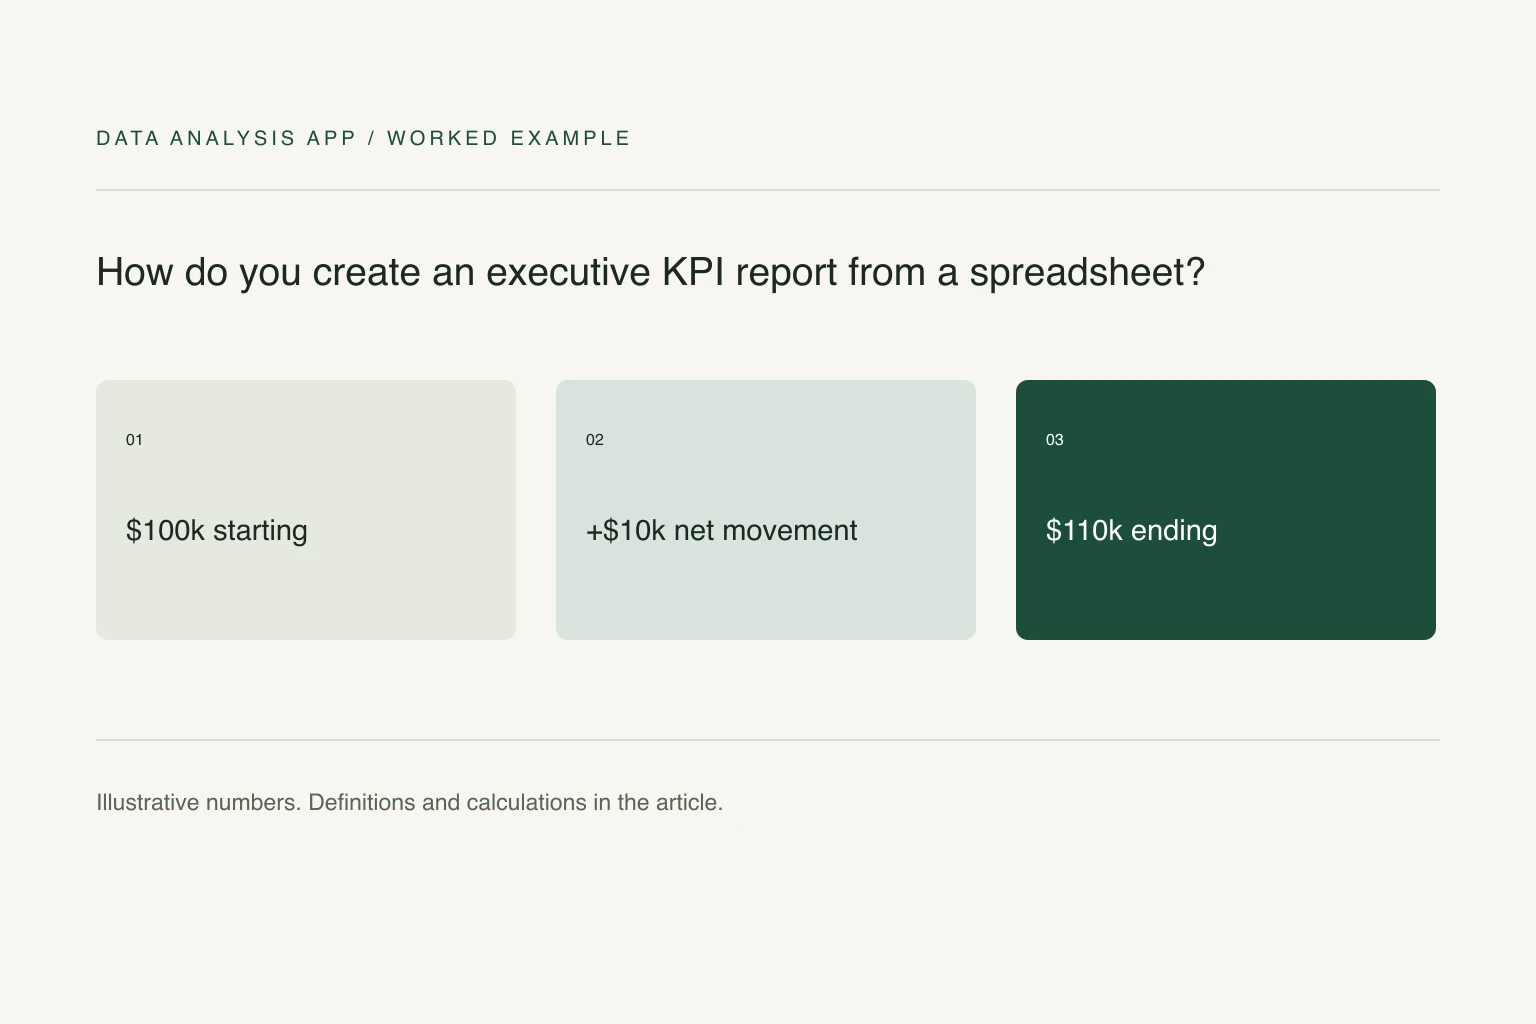
- $110,000
- example ending revenue
- 10%
- reconciled revenue growth
Key takeaways
- Define each KPI before choosing its chart.
- A revenue bridge reconciles movement but does not establish causation.
- Place uncertainty beside the finding and finish with an owner and review date.
An executive report should tell the reader what changed, how certain that conclusion is, and what decision follows. A page of green indicators can still fail if every metric uses a different period or nobody can explain a surprising number. Start with the decision, then select the evidence that can change it.
The example here is a fictional monthly operating review. It uses a revenue bridge to show the difference between describing a movement and explaining it. Replace the definitions with those your business actually uses before applying the calculations.
Section 01
Write a metric contract before making the slide
For each KPI, record the name, formula, source, period, filters, unit, owner, and comparison. Revenue booked, revenue recognized, and cash collected can all be legitimate measures, but substituting one for another changes the story. Keep definitions short enough to fit in a footnote or linked appendix.
Use comparable periods. A partial month should not be plotted against an entire prior month without an explicit adjustment. State whether the report includes refunds, taxes, test accounts, internal transactions, and late-arriving records. The dashboard trust checklist is a practical way to check these assumptions before a chart becomes the headline.
In Excel, SUMIFS can total transactions by period and a defined movement category. Keep uncategorized rows visible and reconcile the grouped sum to the source; an exact formula cannot compensate for an inconsistent classification.
Section 02
Explain the movement with a bridge
Suppose the previous month's revenue was $100,000. New customers added $15,000, existing customers expanded by $8,000, contractions removed $3,000, and lost customers removed $10,000. The bridge is $100,000 + $15,000 + $8,000 - $3,000 - $10,000 = $110,000. Reported growth is 10%, and every component reconciles to it.
Do not claim that the $15,000 proves a marketing campaign worked merely because both occurred in the same month. The bridge explains where the arithmetic came from, not what caused it. If an account classification is uncertain, show the unresolved amount rather than forcing every transaction into the story you expected.
Section 03
Give the reader the comparison that changes the decision
The 10% growth headline means different things against a $105,000 plan and a $130,000 plan. Show the absolute result, the prior-period change, and the plan difference with clear labels. Use percentage points for differences between rates: a margin moving from 30% to 33% rose three percentage points, even though its relative increase is 10%.
Avoid a composite health score unless the calculation and weighting are governed and useful. Three separate measures with named owners are often more actionable than one score that can rise while a critical component deteriorates. Keep a small core set on the main page and move diagnostic detail to the appendix.
Section 04
Put uncertainty next to the claim
A report should distinguish confirmed amounts, estimates, and missing coverage. If 8% of transactions arrived without a region, the regional breakdown is incomplete. That missing group belongs in the table. Assigning it proportionally to known regions may make the chart look finished while hiding the data-quality problem.
For any forecast, state the assumptions and show a range or scenarios where appropriate. Observed growth is not a guarantee of future growth. If the next action depends on an estimate, name the evidence that would change the decision. A short limitation beside the headline is more useful than a generic disclaimer several pages away.
Section 05
Finish with a decision record
Use one sentence for the finding, one for its operational implication, and one for the proposed action. For example: revenue grew 10%, but $10,000 of lost-customer revenue offset much of the new business; investigate those departures before expanding acquisition spending. Add an owner and review date so the same recommendation does not recur without resolution.
Keep the underlying export, metric definitions, and reconciled bridge available. The quarterly board-pack example shows a finished presentation structure. To review your own spreadsheet, start with a free analysis, check the evidence, and decide whether the downloadable report or deck is useful for your meeting. Presentation quality should make the reasoning easier to assess, not cover up a missing calculation.
See it on a real project
Contractor spend rose $412,000 while headcount spend fell $448,000, leaving only a $4,000 net change.
Keep reading
Evidence
Sources
- Microsoft (2026). Sum values based on multiple conditions Microsoft Support.
- Data Analysis App team (2026). Related method: before you trust a dashboard.
- Data Analysis App team (2026). Quarterly board-pack worked example.